What is the Microsoft Graph Activity Log?
It’s important to see all activity in today’s Microsoft 365 setups for security. Standard logs don’t always show the full story, especially with apps and scripts, which is why the Microsoft Graph Activity Log is so important.
This first article in a series explains the basics of this logging feature. Readers will learn what the Graph Activity Log is, the insights it offers, how to set it up, and how to start querying it. Understanding these fundamentals is key for any organization to improve monitoring, investigation, and overall Microsoft 365 security. And this is just the start. Future articles will explore real-world uses, like investigating mailbox breaches (Part 2), document exfiltration (Part 3), and OAuth app abuse (Part 4) using these logs.

What Exactly Is the Microsoft Graph Activity Log?
The Microsoft Graph serves as the ubiquitous API gateway to data and intelligence within Microsoft 365. It’s the engine enabling countless applications, whether line-of-business applications, API clients, SDKs, or even Microsoft’s own applications like Outlook, Microsoft Teams, and the Microsoft Entra admin center. It facilitates their interaction with various services like Entra ID, Exchange Online, and SharePoint Online.
The Microsoft Graph Activity Log provides an audit trail of all HTTP requests that the Microsoft Graph service receives and processes for a tenant.
These logs capture comprehensive details about each API request, including:
- API Request Specifics: Comprehensive details of the API call, including the precise endpoint URI, like GET /users, POST /me/sendMail, the utilized HTTP method, and the designated API version.
- Caller Identification: The Application Identifier (AppId) of the client application initiating the request. This also encompasses the User Identifier (UserId) for requests executed under delegated user permissions, or the ServicePrincipalId for requests made with application permissions.
- Authentication and Authorization Attributes: Pertinent data concerning the authentication and authorization processes, such as ClientAuthMethod (indicating the method of client authentication), Roles and Scopes derived from token claims, and the TokenIssuedAt timestamp.
- Request and Response Metrics: Operational data points including the ClientRequestId (if provided by the client), the unique RequestId assigned by the service, DurationMs (representing the request processing time in milliseconds), the resulting ResponseStatusCode such as 200, 403 or 429, and the ResponseSizeBytes.
- Environmental Context: Supplementary information pertaining to the request’s environment, such as the originating IPAddress of the client, the UserAgent string, the geographical Location of the Microsoft datacenters that processed the request, the DeviceId (if applicable), and the AadTenantId.
The logs capture detailed information about API activities, providing valuable visibility into how interactions and changes take place within the Microsoft 365 environment. This data plays a vital role in monitoring and analyzing programmatic access and operations.
Why is the Microsoft Graph Activity Log a Game-Changer?
The Microsoft Graph Activity Log is a game-changer for administrators and security teams primarily because it offers a depth of visibility into API interactions that traditional logs often cannot match. It delivers comprehensive insights into every transaction made by consented applications and API clients within the tenant, critically extending to non-interactive access from background processes, headless scripts, and other automated activities. This granular data facilitates a more complete audit trail, especially when API requests are correlated with Microsoft Entra ID for sign-in information.
For security operations, Graph Activity Logs offer detailed insights into user and app behavior. They help trace actions by compromised accounts, detect unusual API usage, and reveal over-privileged or suspicious app permissions, which enable precise threat detection and investigation.
Getting Started: Enabling Microsoft Graph Activity Logs
Tenant administrators can enable the collection of Microsoft Graph activity logs using diagnostic settings in Azure Monitor. These logs can then be sent to various destinations:
- Azure Log Analytics workspace: For analysis using Kusto Query Language (KQL), building dashboards, and setting up alerts. (This is the primary focus for querying in this article).
- Azure Storage account: For long-term archival and compliance.
- Azure Event Hubs: To stream logs to external Security Information and Event Management (SIEM) tools or other custom solutions for alerting, analysis, or archival.
Before using Log Analytics, it’s important to select the appropriate pricing plan. Available options include Pay-As-You-Go and Commitment Tiers, which offer discounts based on daily data ingestion levels such as 100GB/day, 200GB/day. For environments with consistently high data ingestion, Commitment Tiers can reduce costs. Data usage trends should be reviewed regularly to determine the most cost-effective option. The following steps outline the configuration process via the Microsoft Entra admin center to send logs to a Log Analytics workspace.

Steps via the Entra Admin Center
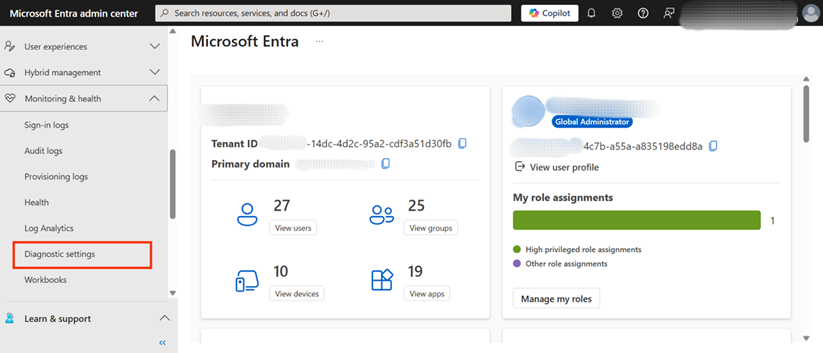
- Navigate to the Microsoft Entra admin center.
- Once in the admin center, locate the “Monitoring & health” section in the left-hand navigation menu. Expand this section and then select Diagnostic settings. Figure 1 illustrates this navigation, highlighting “Diagnostic settings” in the menu.
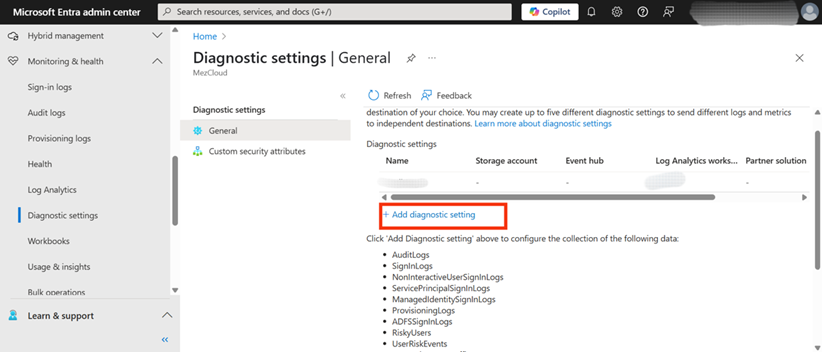
3. On the “Diagnostic settings | General” page, there will be an option to create a new configuration. Click on the + Add diagnostic setting button to begin the setup process. Figure 2 shows this button, which is the starting point for defining where the logs will be sent.
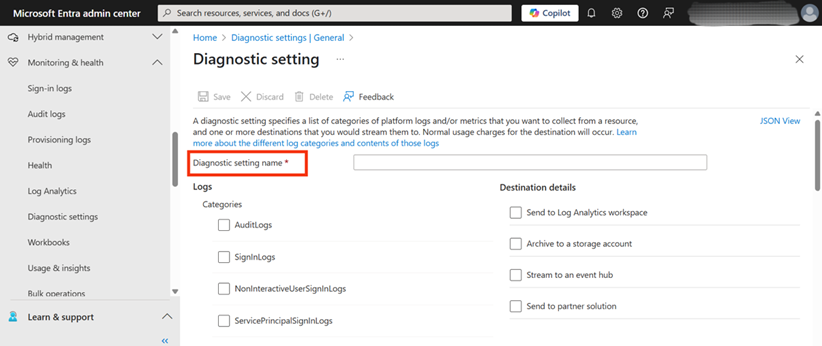
4. A crucial step is to provide a descriptive name for this new diagnostic setting. Enter a name in the “Diagnostic setting name” field. Any suitable name can be chosen that helps in identifying this configuration later, as shown in Figure 3, where the field is highlighted.
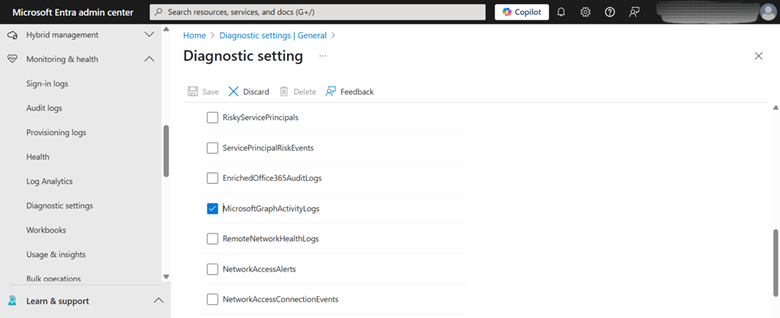
5. Under the “Logs” section, specifically within “Categories,” locate and check the box for MicrosoftGraphActivityLogs. This action specifies that these are the logs to be collected and routed. Figure 4 clearly shows the “MicrosoftGraphActivityLogs” option being selected from the list of available log categories.
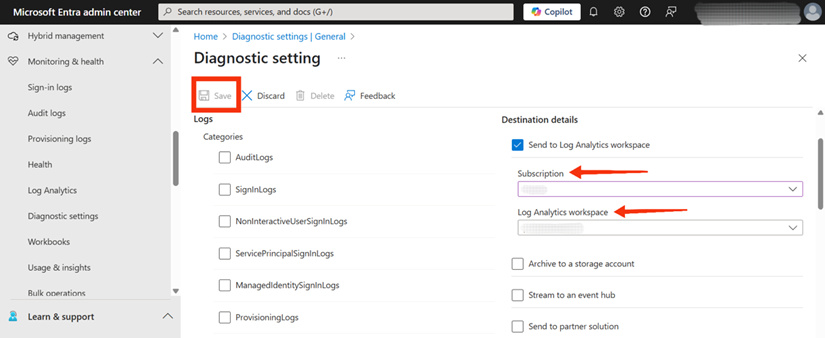
6. Then choose Send to Log Analytics workspace as the destination for the logs. This will enable the logs to be queried and analyzed using KQL.
- Next, select the appropriate Subscription from the dropdown list.
- Then, choose the desired Log Analytics workspace where the logs will be stored and analyzed. If a suitable Log Analytics workspace doesn’t already exist, one must be created before it can be selected here.
After all the details have been correctly entered and selected, click the Save button to apply the new diagnostic setting. Figure 5 points to the selection areas for the subscription and Log Analytics workspace.
Verify the Log Flow:
The flow of Microsoft Graph Activity Logs can be verified and the logs subsequently queried, using two primary methods: querying directly within the Log Analytics workspace or by leveraging the Azure PowerShell SDK in Visual Studio Code. Both approaches are detailed in the sections that follow.
Using Log Analytics Workspace:
Once the diagnostic setting is enabled, logs are captured. Typically, events are delivered to their configured destination within 30 minutes in most regions. However, in some less common instances, delivery of certain events might take up to 2 hours. After this period, it’s crucial to confirm that data is being ingested into the Log Analytics workspace.
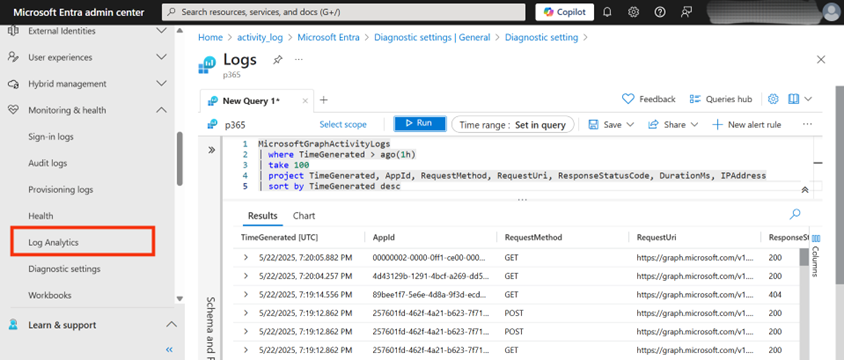
Execute the following Kusto Query Language (KQL) query in the selected Log Analytics Workspace to retrieve a sample of the logs:
MicrosoftGraphActivityLogs
| where TimeGenerated > ago(1h)
| take 100
| project TimeGenerated, AppId, RequestMethod, RequestUri, ResponseStatusCode, DurationMs, IPAddress
| sort by TimeGenerated desc
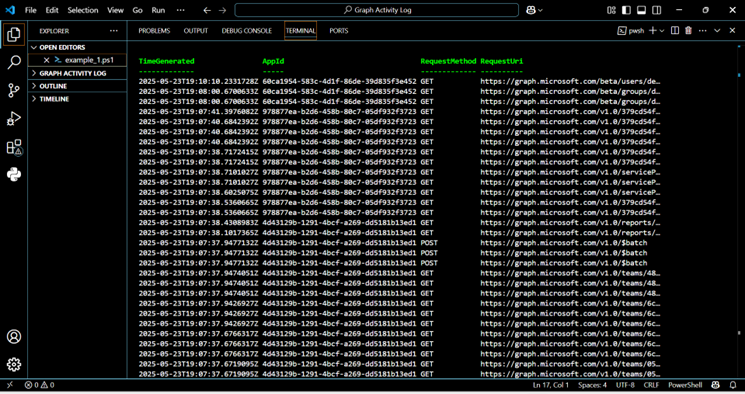
As Figure 6 shows, the output of this query displays a sample of recent Microsoft Graph API interactions. Each row details when an API call occurred (TimeGenerated), the application involved (AppId), the HTTP method used (RequestMethod), the specific API endpoint accessed (RequestUri), the server’s response status (ResponseStatusCode), the request duration (DurationMs), and the caller’s IP address (IPAddress). This provides a snapshot of key operational details from recent API activities.
Leveraging the Azure PowerShell SDK in VS Code for Graph Activity Log Queries:
This approach is particularly useful for individuals or teams who prefer a script-based workflow or aim to automate log retrieval and analysis. Expect this query for 100 recent MicrosoftGraphActivityLogs to run in seconds to a few minutes. In our case, it takes only 15 seconds. Actual time will depend on data volume and current Azure service performance.
Querying Graph Activity Logs with VS Code and PowerShell
Beyond the Azure portal, it is possible to leverage the power of Visual Studio Code (VS Code) combined with PowerShell to query Microsoft Graph Activity Logs. This approach is particularly useful for individuals or teams who prefer a script-based workflow or aim to automate log retrieval and analysis.
Prerequisites
Prior to execution, it is necessary to confirm that the Azure PowerShell module, specifically Az.OperationalInsights, is available within the Visual Studio Code environment. This module is required for interaction with Log Analytics workspaces and can be installed by executing the following script in a PowerShell terminal if it is not already present.
Install-Module Az.OperationalInsights -Scope CurrentUser
The following script demonstrates connecting to an Azure account and executing a KQL query against a specified Log Analytics workspace. This query is exactly the one used in the Log Analytics Workspace for verifying log flow.
Connect-AzAccount

$workspaceId = "f7cd80f3-2cac-42f4-9acc-cba357e9468d"
$csvFilePath = ".\GraphActivityLogs.csv"

$query = @"
MicrosoftGraphActivityLogs
| where TimeGenerated > ago(1h)
| take 100
| project TimeGenerated, AppId, RequestMethod, RequestUri, ResponseStatusCode, DurationMs, IPAddress
| sort by TimeGenerated desc
"@

# Inform the user about the query being executed
Write-Host "Running the query against Workspace ID: $workspaceId"

try {
    $result = Invoke-AzOperationalInsightsQuery -WorkspaceId $workspaceId -Query $query -ErrorAction Stop

    # Display results and save to CSV
    if ($result.Results) {
        Write-Host "Query executed successfully. Displaying results:"
        $result.Results | Format-Table

        # Save the results to a CSV file
        Write-Host "Saving results to $csvFilePath..."
        $result.Results | Export-Csv -Path $csvFilePath -NoTypeInformation -Encoding UTF8
        Write-Host "Results successfully saved to $csvFilePath"

    } else {
        Write-Host "Query executed, but no results were returned."
    }
}
catch {
    # Handle any errors that occur during query execution
    Write-Error "An error occurred while running the query: $($_.Exception.Message)"
}
# Additional information for the user
For the script to operate correctly, the $workspaceId variable needs to be assigned the specific Log Analytics Workspace ID, and $csvFilePath must define the complete path where the CSV output file will be saved. This ID can be located in the Azure portal. Successful script initialization will prompt an authentication process to connect to the appropriate Azure Account. Subsequently, the correct subscription needs to be selected by its name. Upon successful execution of these steps, the output will be displayed. Also, a CSV file will be saved in the corresponding file path, corresponding to the example shown in Figure 7.
Microsoft Graph Activity Log Essentials
This first article covers the essentials of the Microsoft Graph Activity Log, what it does, its importance for visibility, and how to get it running to start seeing the data. Mastering these basics is key for any organization to better understand its Microsoft 365 activity and strengthen its security. With this foundation in place, the next article in this series will jump into a practical example, showing how to use these logs to investigate potential mailbox breaches. It’s all about giving teams better tools to protect their Microsoft 365 environment.