
Fairly recently, I had a conversation with someone who lamented that Microsoft isn’t a security company and often they need to look to third-party products to fill the gaps.
It is fair to say that’s a pretty common and reasonable view given the history of Microsoft in the security arena. Things have of course changed significantly over the last few years – and within the Microsoft 365 suite, there are lots of security products available.
Until now though, Microsoft haven’t had their own cloud-based Security Information and Event Management (SIEM) product.
Azure Sentinel isn’t Microsoft’s attempt at trying to change this. It isn’t part of Office 365 or EMS but is a service that can take security data from many sources – PCs, Windows and Linux servers, SaaS platforms, Cloud App Security and Office 365, and helps you to resolve threats.
What Azure Sentinel doesn’t replace is a regular reporting tooling. For example, third-party reporting products for Office 365 serve a purpose and most likely will continue to do so.
In this article, we’ll get started with the Azure Sentinel Preview and connect it to Azure AD and Office 365.
Start by creating a log analytics workspace
Azure Sentinel uses Log Analytics. You might be familiar with Log Analytics if you’ve used services like Windows Analytics for upgrade readiness. You might also be familiar with it under its former name – Operations Management Suite, or OMS.
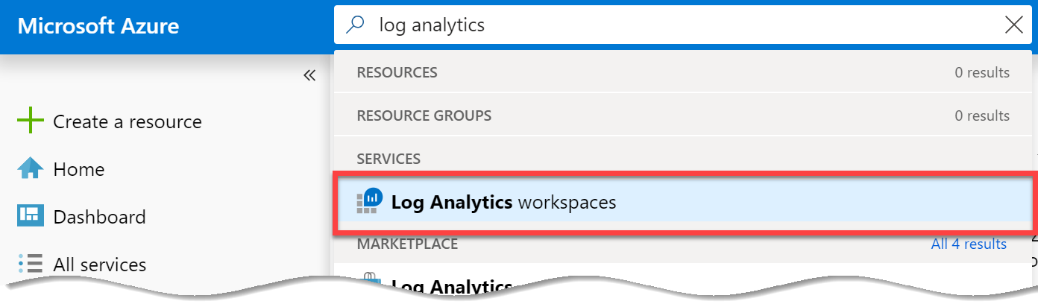
We’ll start by creating a Log Analytics workspace. To do this, visit the Azure Portal at portal.azure.com and from the search bar, type Log analytics and choose it under the Services heading:
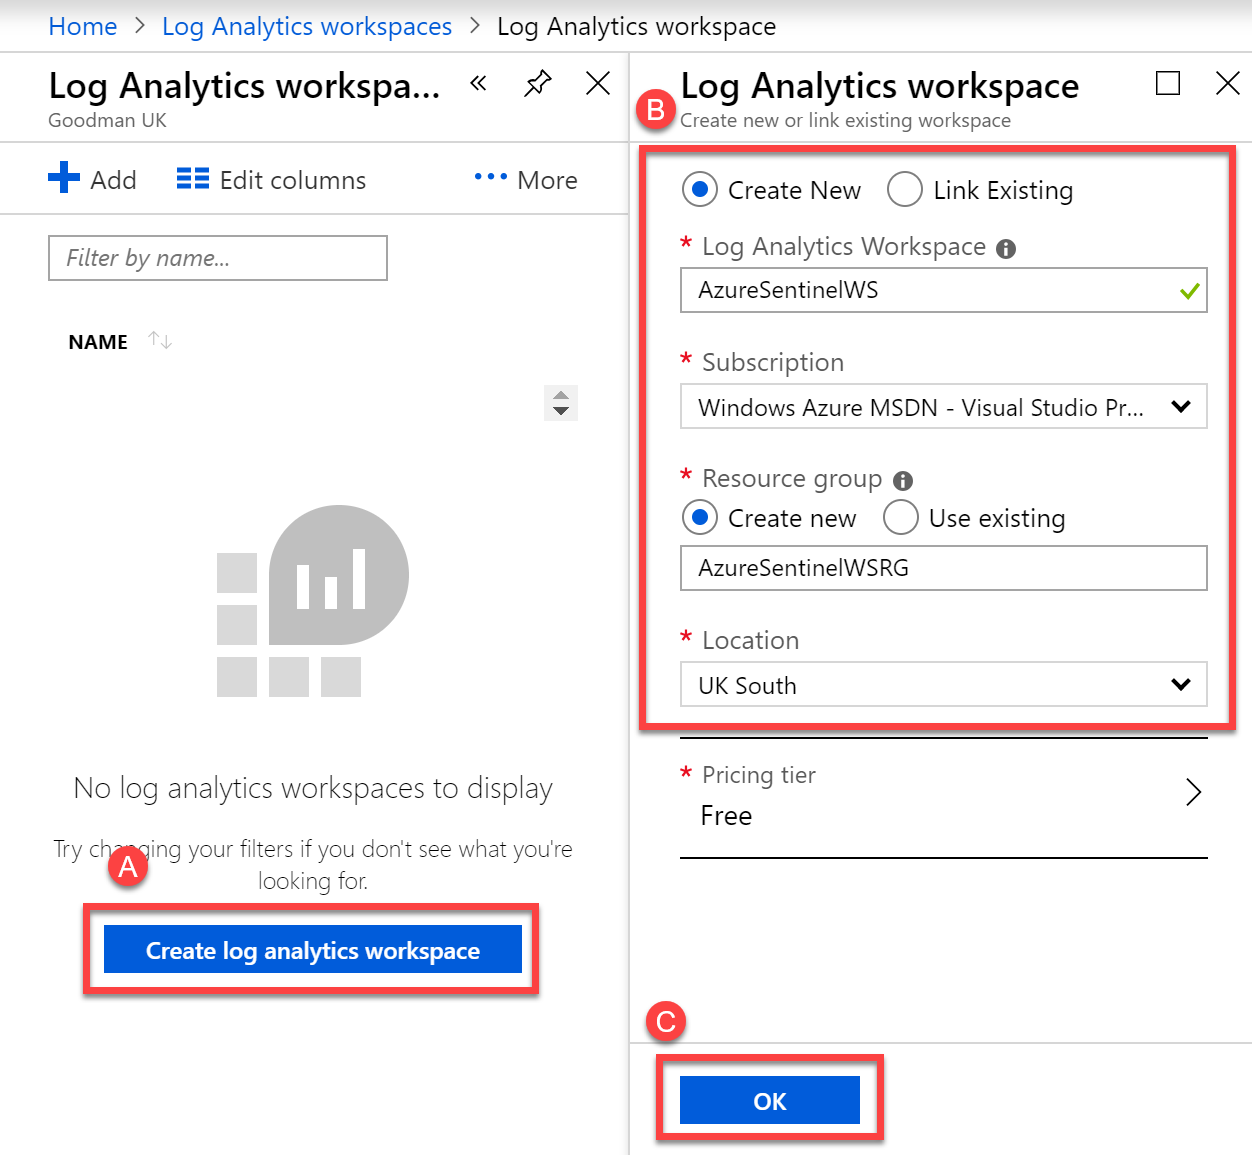
We’ll then choose to Create a log analytics workspace and then, as shown in B, create a new workspace with a relevant name and resource group. In my example, I’ve chosen the name AzureSentinelWS, and created a new Resource Group dedicated to this. I’ve chosen to store the data within the UK and selected the Free pricing tier. Finally, I’ve chosen OK to commence creation of the new workspace:
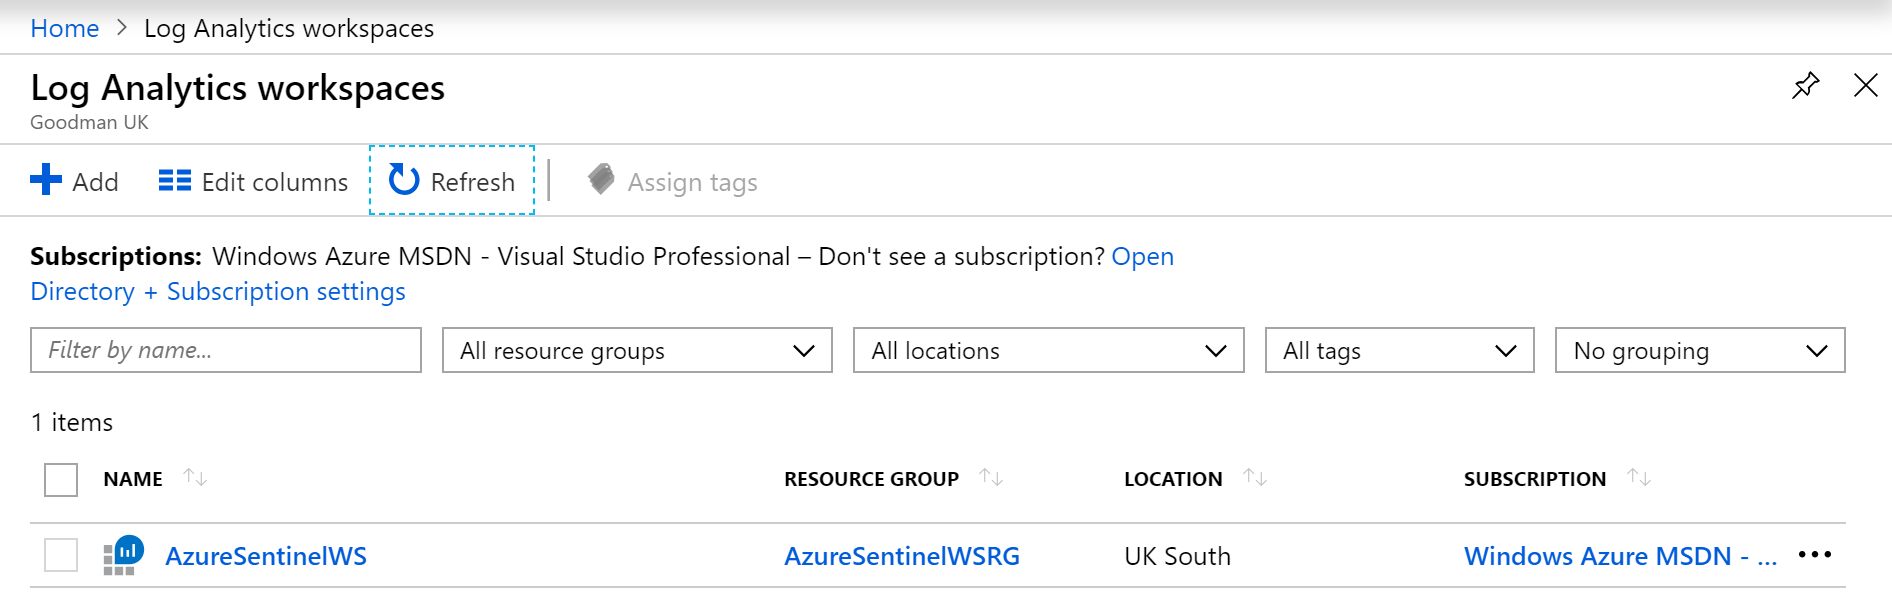
After a few moments, we’ll now see the new AzureSentinelWS within the list, on the Log Analytics workspaces homepage in the Azure Portal:
Set up Azure Sentinel
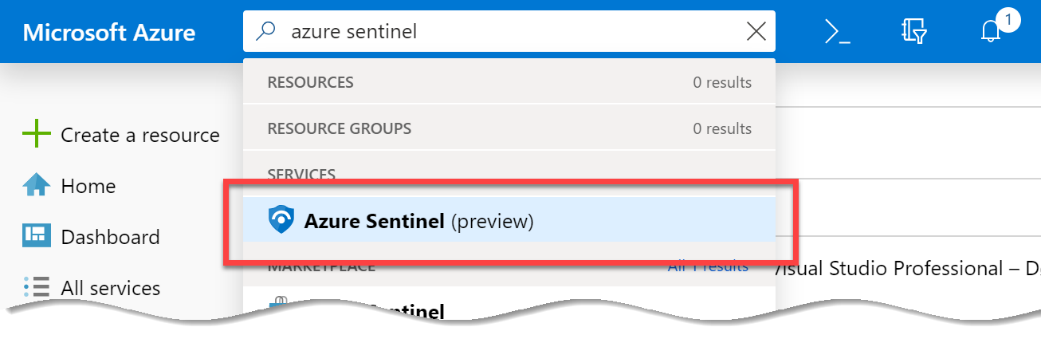
With our new Log Analytics workspace created, we’ll now search within the Azure Portal for Azure Sentinel and select it within the Services section:
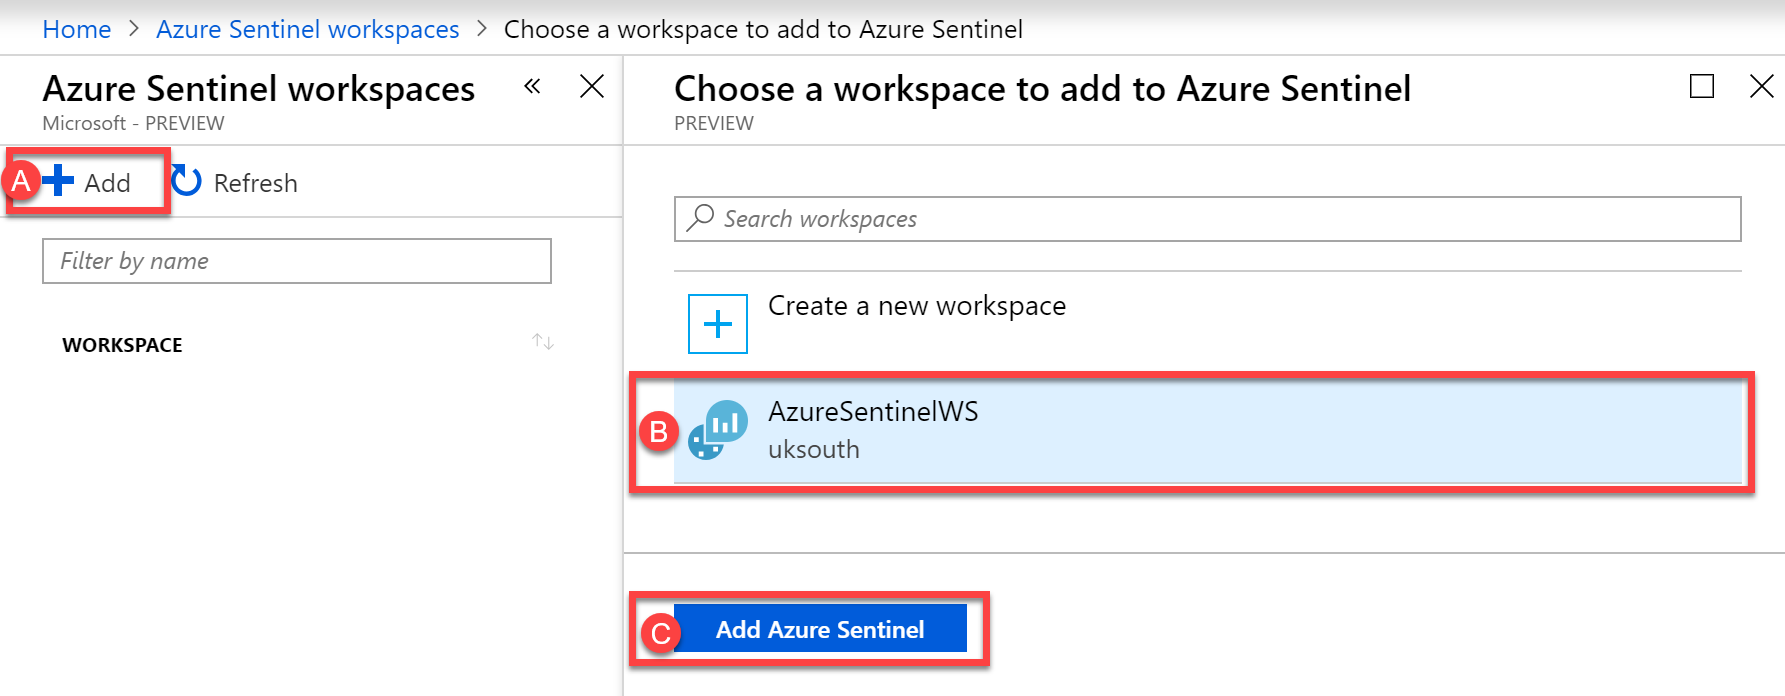
To create our new Azure Sentinel workspace, we’ll choose Add and then, as shown in B, select our AzureSentinelWS instance of Log Analytics. This will be where the collected data is stored. Finally, we’ll choose to Add Azure Sentinel:
As with Log Analytics, we’ll wait a few minutes for the service to be configured.
Link Office 365 Services to Azure Sentinel
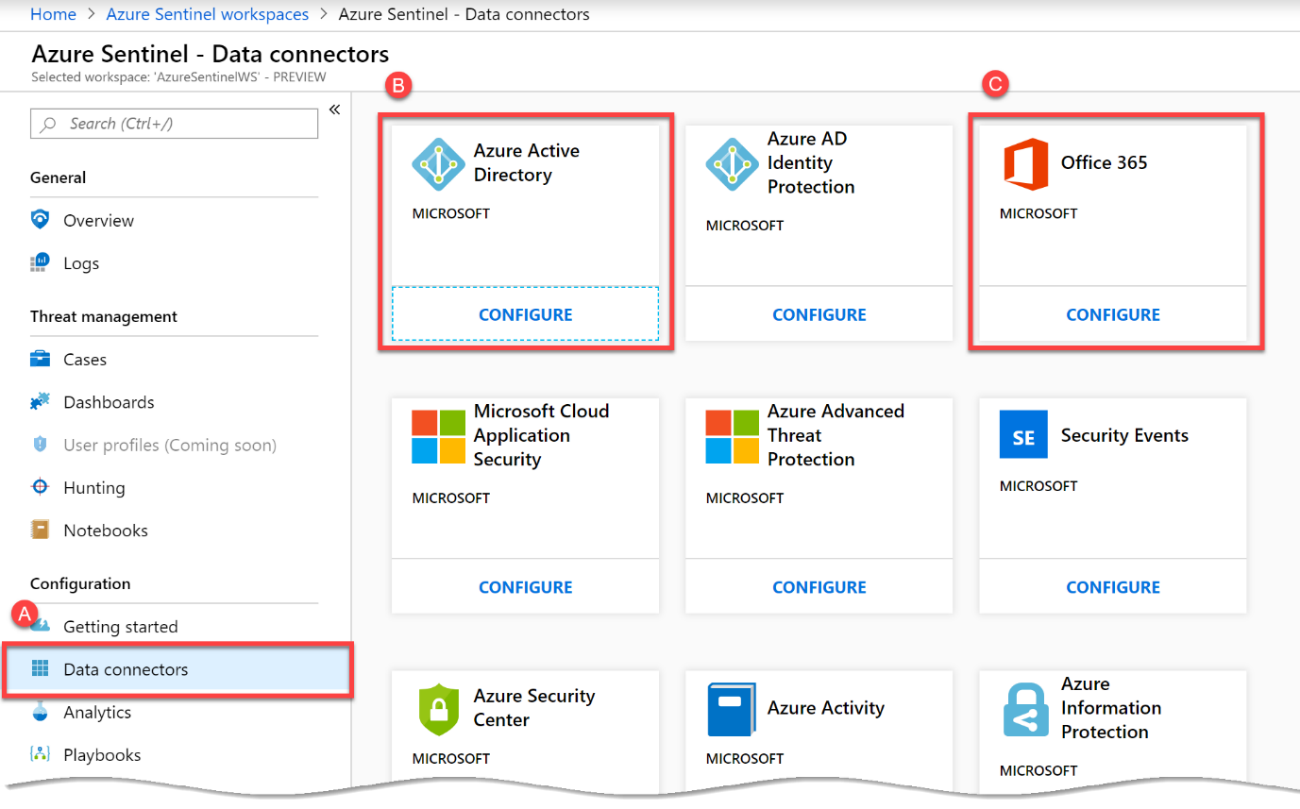
Once Azure Sentinel is configured, we’ll see a large menu of options. These include an Overview of the environment, access to Logs, a section dedicated to Threat Management, including case management, dashboards, threat hunting and notebooks, and a Configuration section.
Within the Configuration section, we’ll select Data Connectors, as shown in A, to configure connections. You’ll immediately see we have built-in options to collect data from a variety of sources – including ATP, AIP and Microsoft Cloud App security. For the moment, we’ll initially choose to configure Azure Active Directory before configuring Office 365.
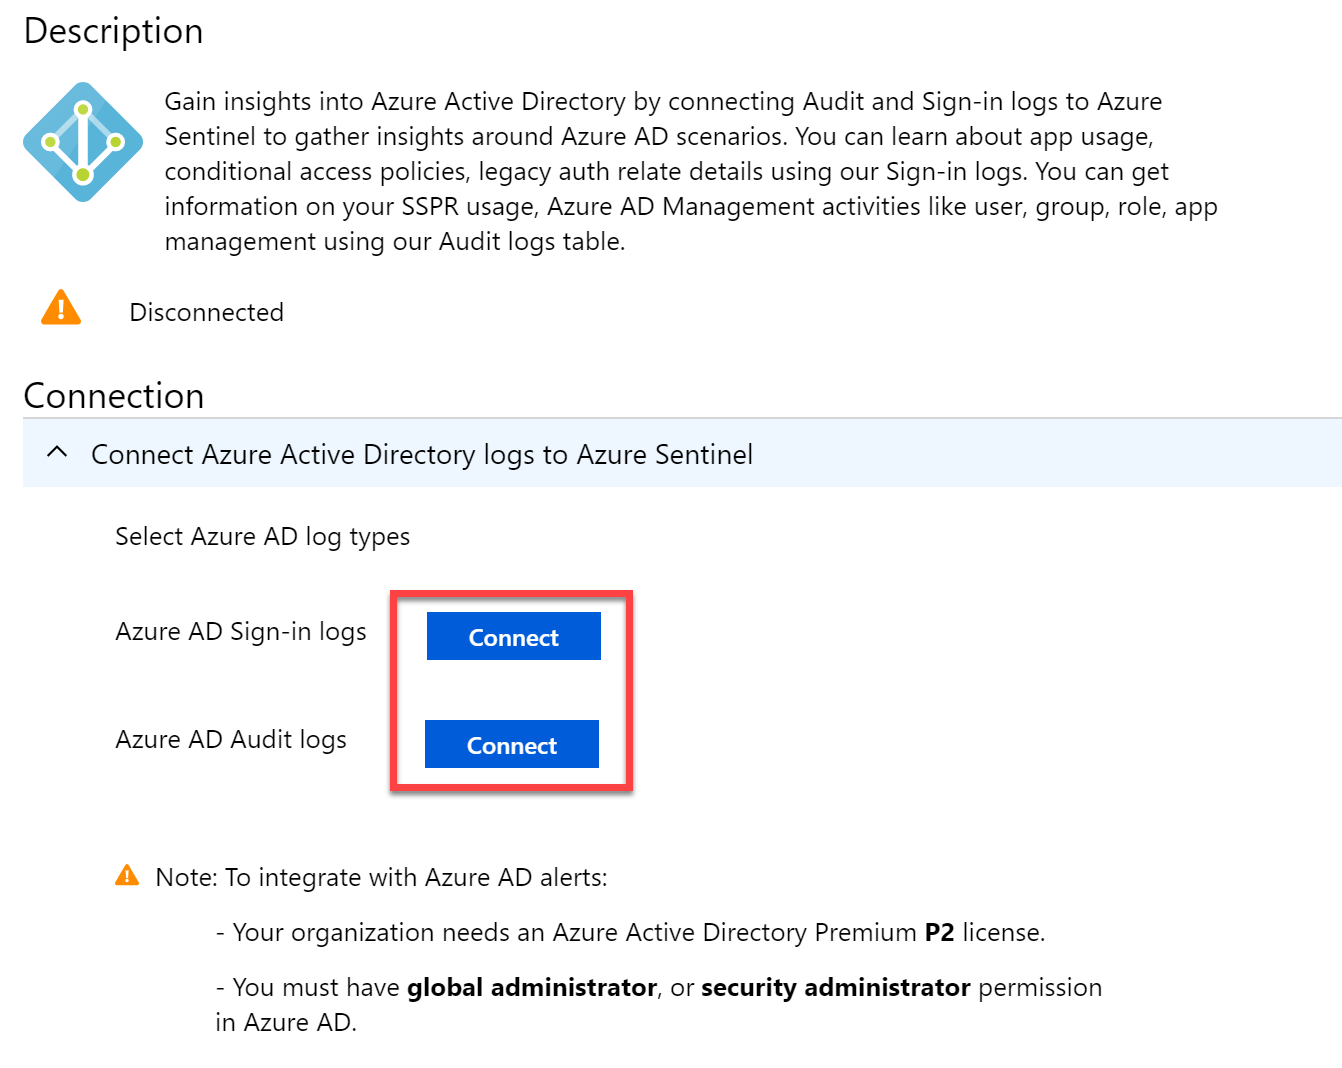
Configuration for Azure AD is extremely straightforward. Assuming you are logged into Azure AD as a global administrator, choose Connect for both Audit logs and Sign-in logs to collect data:
After connecting Azure AD, return to the Data Collectors configuration section, and choose Office 365.
Office 365 configuration is slightly more complex, but still simple.
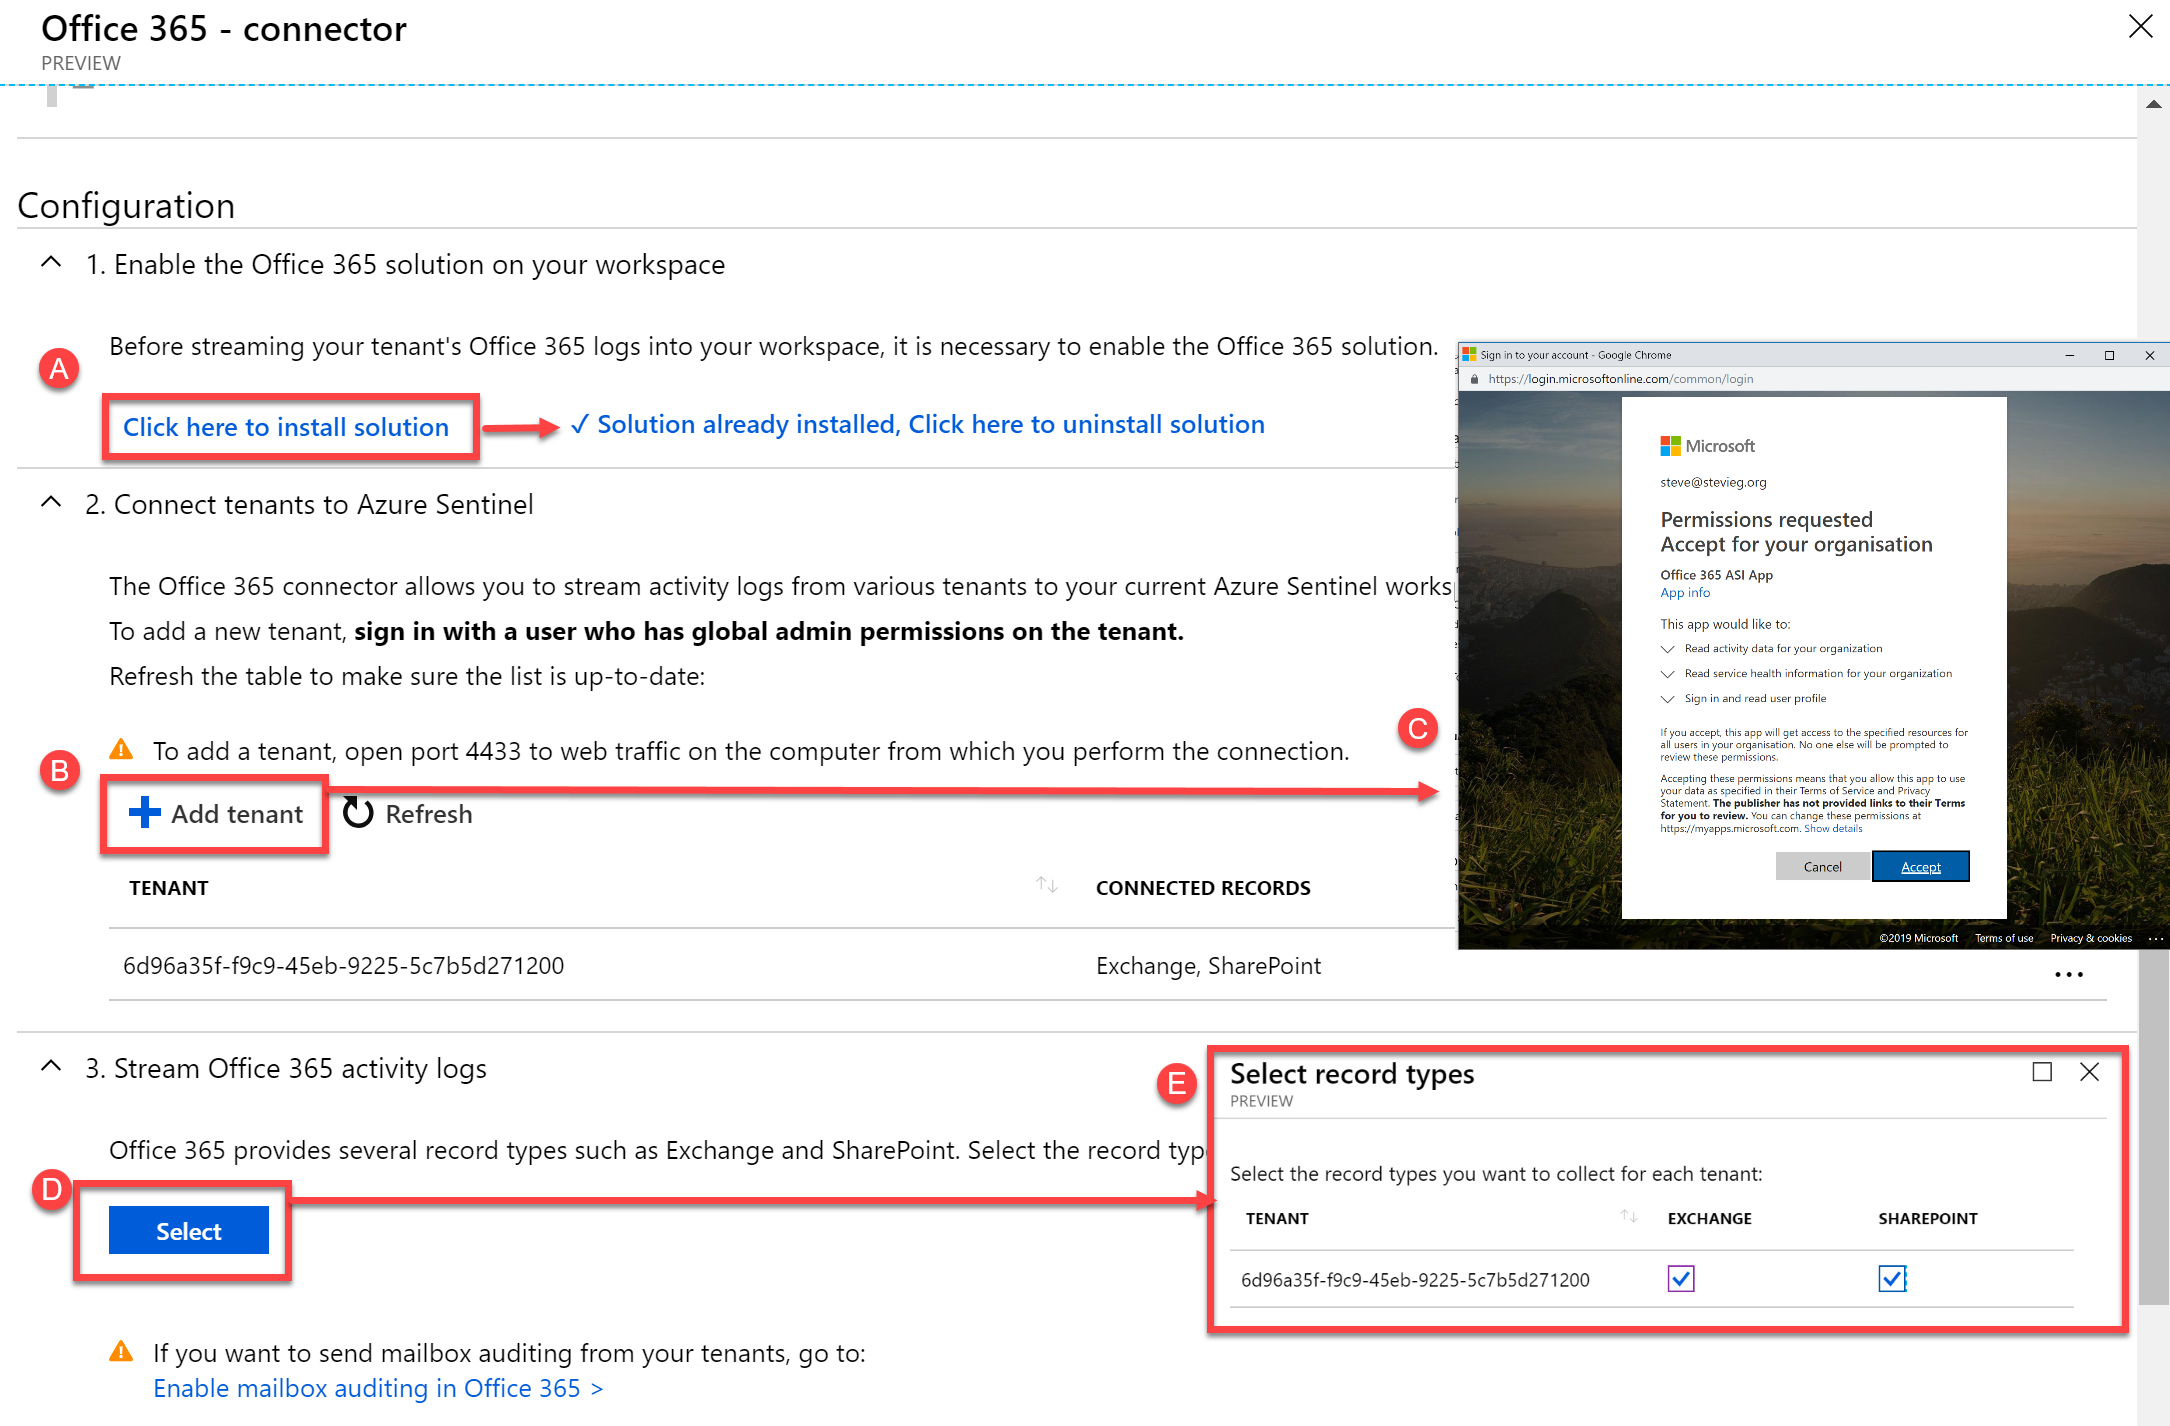
First, as shown in A below, enable the Office 365 solution for Azure Sentinel. To do this, choose Click here to install solution. This link should immediately change to say Solution already installed.
Secondly, as shown in B below, choose Add tenant. You’ll then see a sign-in page as a pop-up browser window, which will ask for consent to read the logs into Azure Sentinel, as shown in C. Assuming you are happy to agree to this, you will see the tenant ID listed in a table below.
Finally, you will need to choose to Stream Office 365 activity logs. To do this, choose Select, as shown in D to choose the supported log types Exchange and SharePoint.
Install Azure Sentinel Dashboards
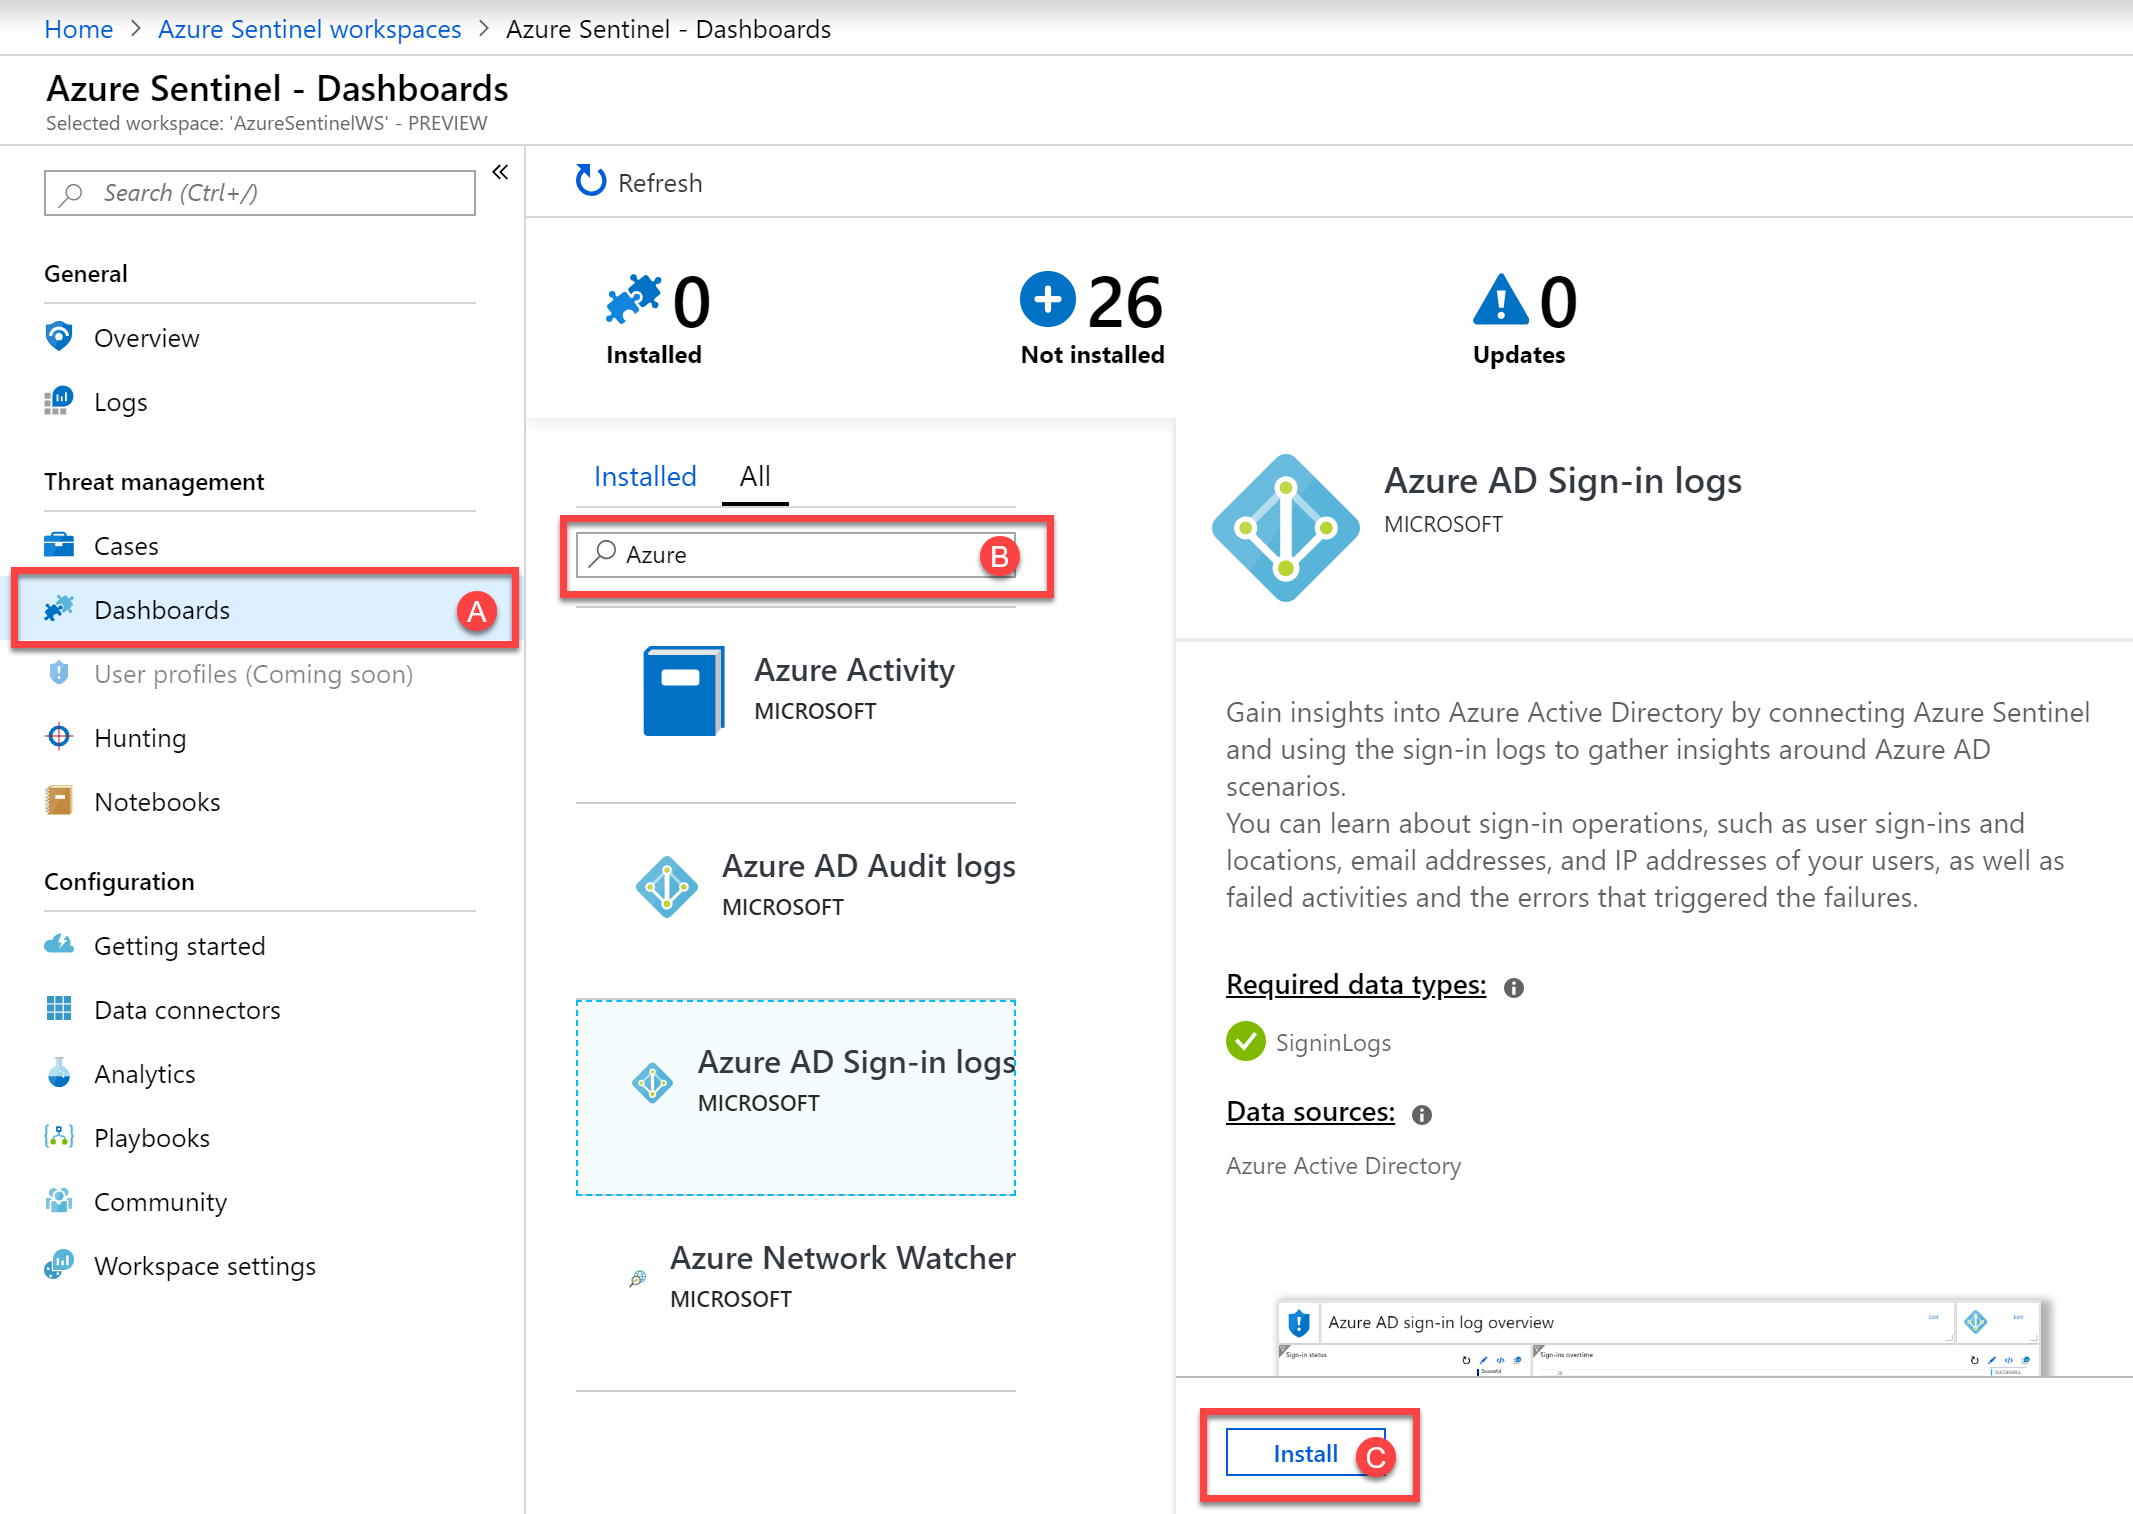
Our final setup task is to install relevant Dashboards. To accomplish this, navigate to the Threat Management section and choose Dashboards.
For both Azure AD Sign-in logs, Azure AD Audit logs, Office 365, Exchange and SharePoint data, first search for the available dashboard, as shown in B, and then choose the Install option.
Viewing collected data
Naturally, before we can act upon any data we need to wait for it to be completed. To product a reasonable amount of data, I’ve waited just over a week – however data immediately appeared within a few hours.
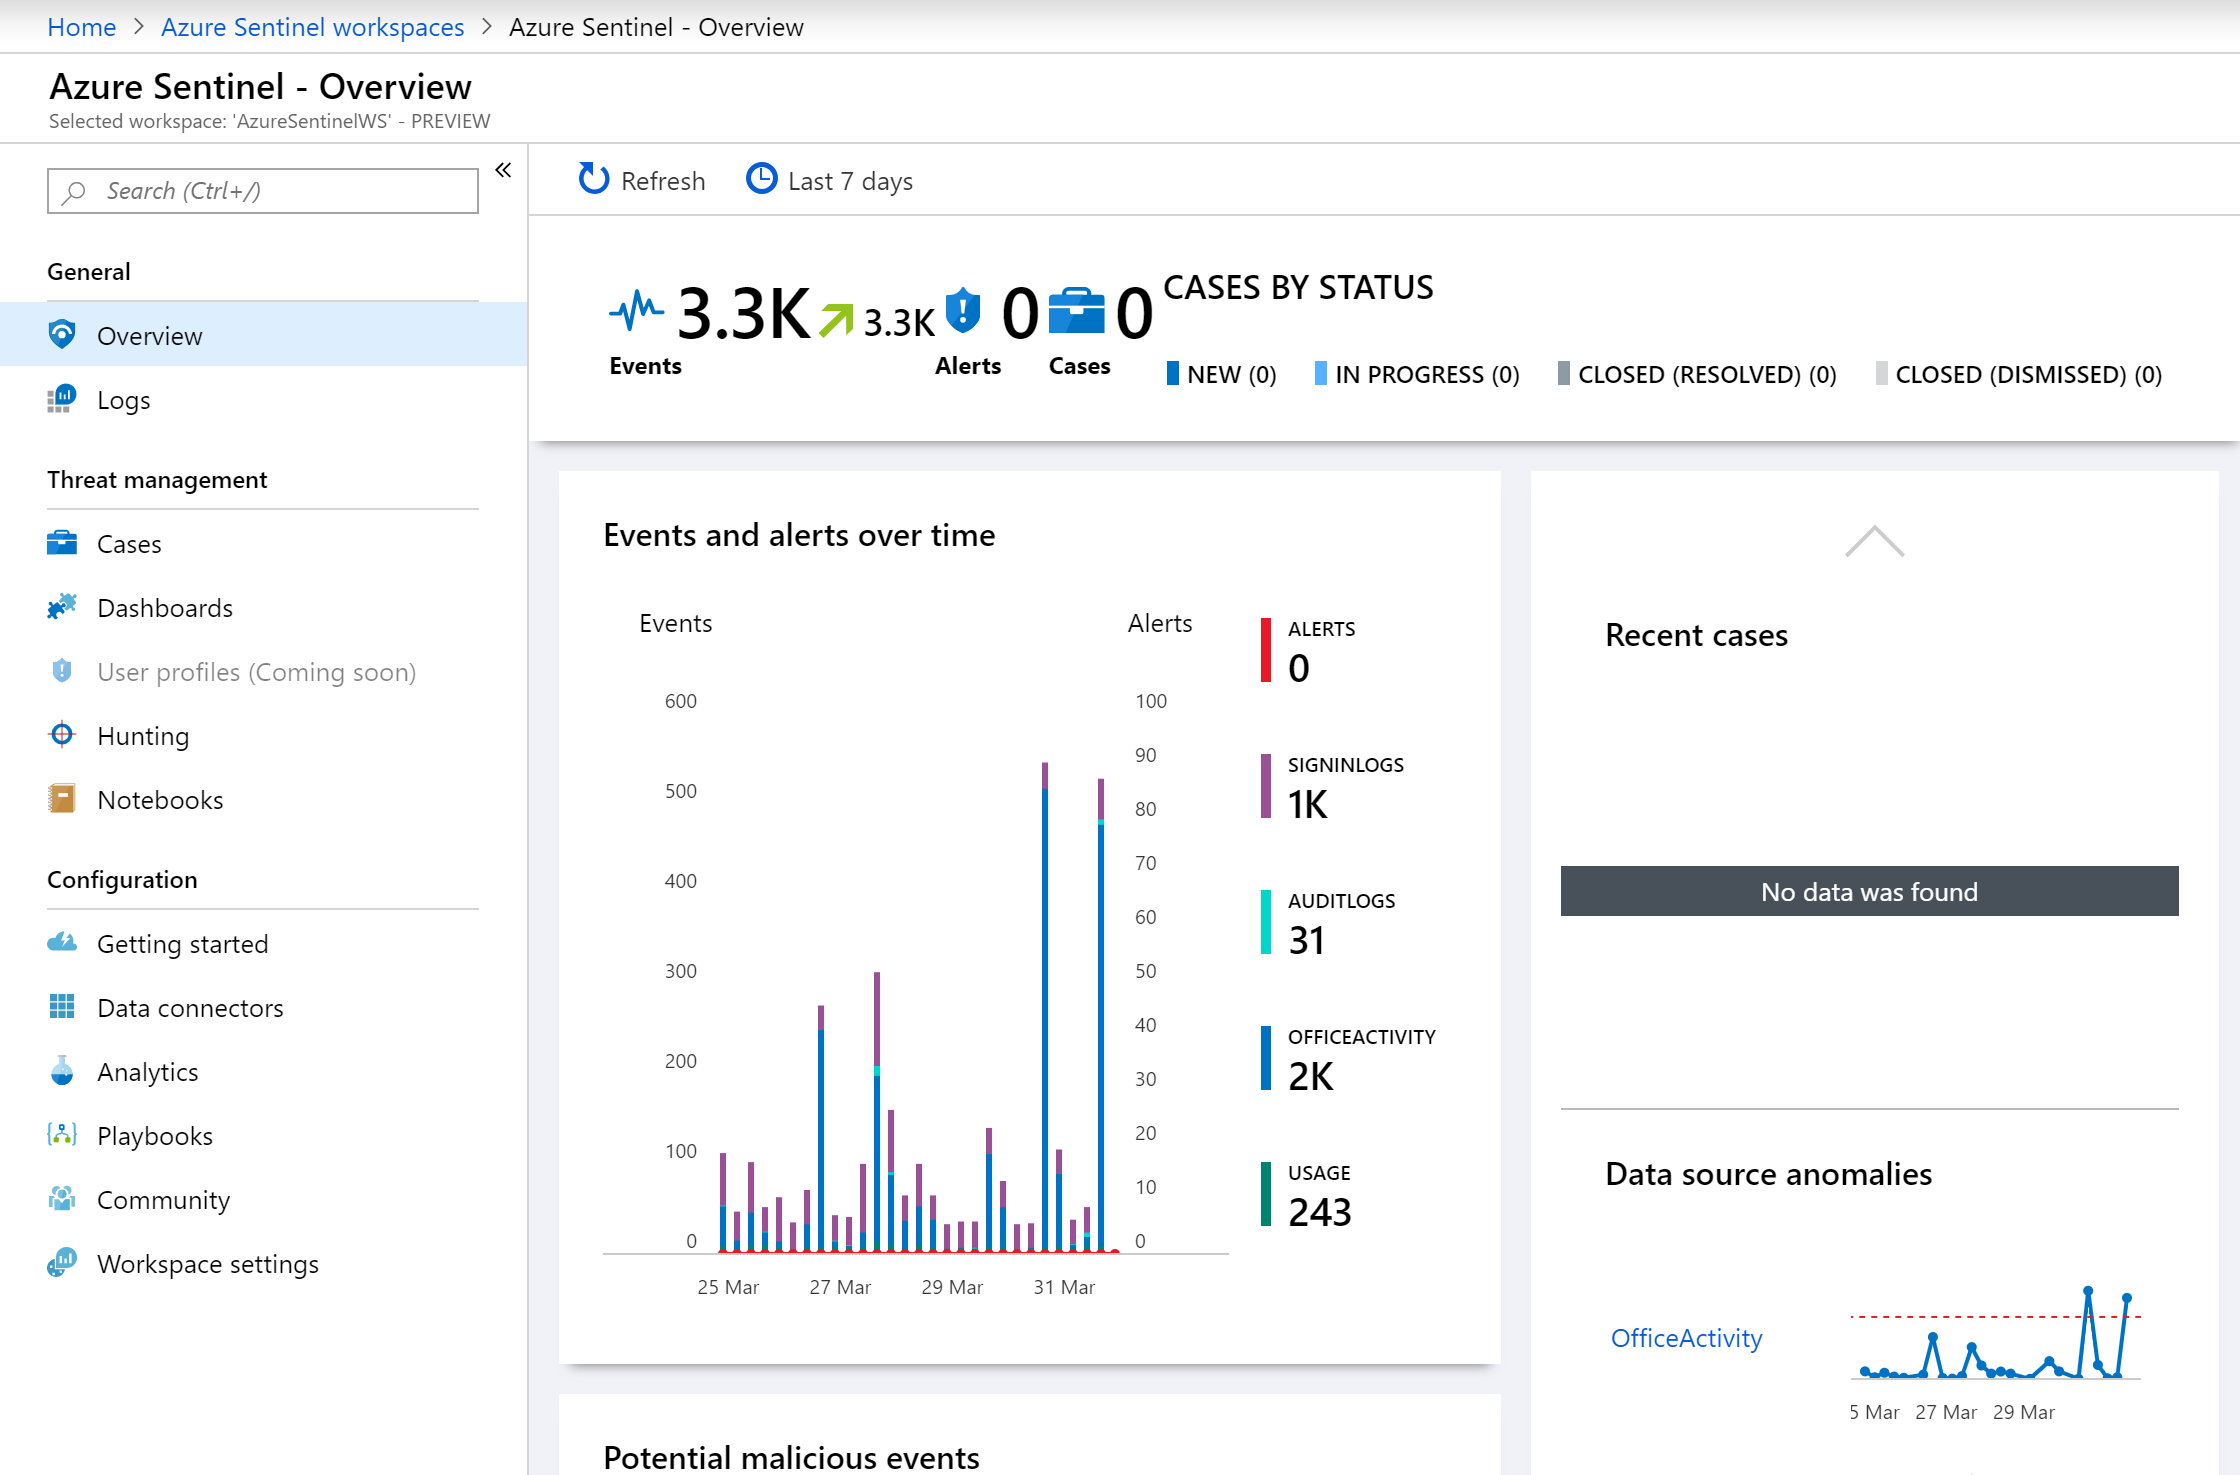
On our Overview page we see events and alerts based upon the raw data stored within the Log Analytics instance. This gives us a breakdown of the data sources and the volume of data. We’ve also got an overview of cases we’ve created, potentially malicious events and anomalies:
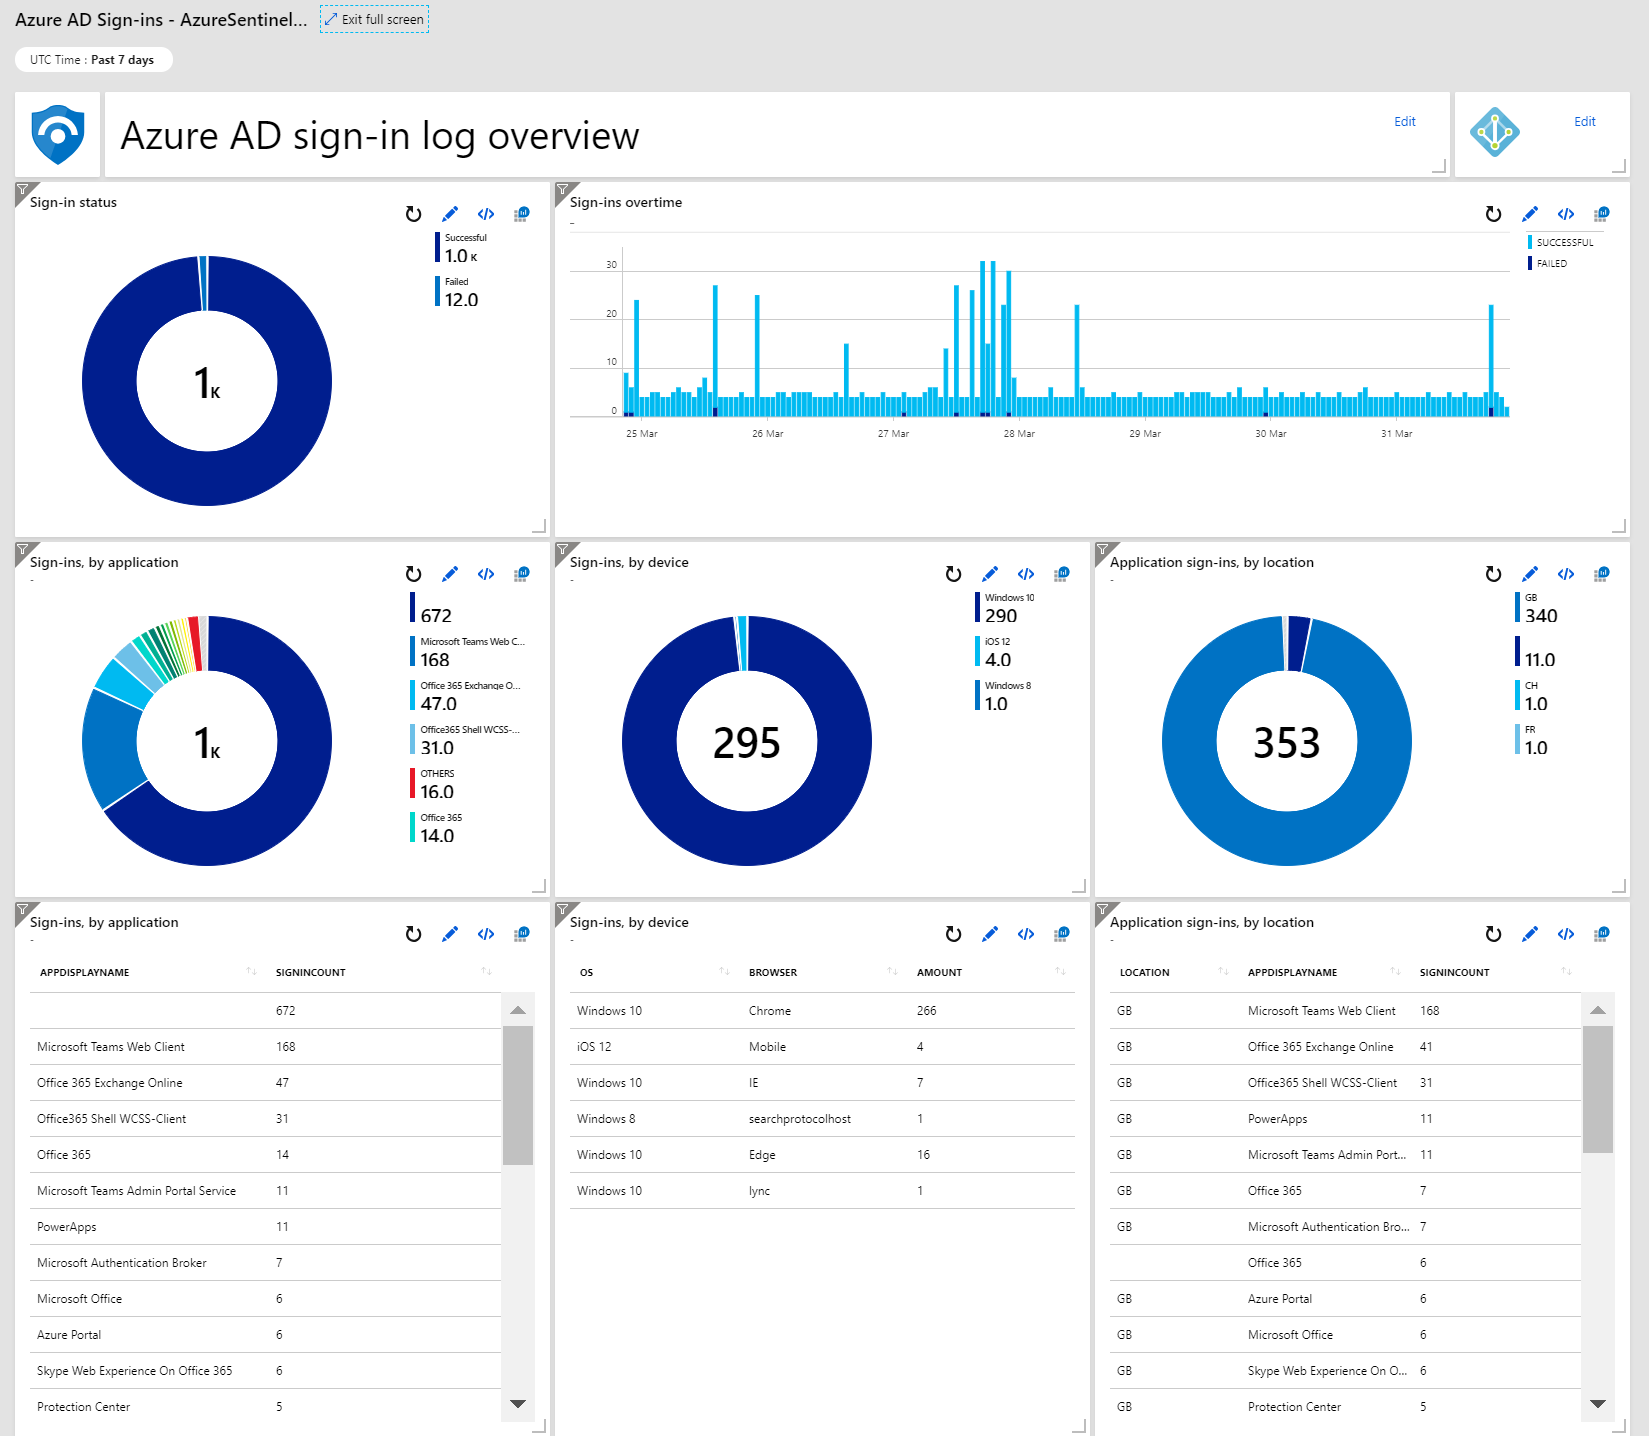
For each Dashboard, we see a detailed break down of the data collected. The Sign-in log overview provides an excellent insight into sign-in activities across all Azure AD services, including details on the devices signing in, applications and even locations:
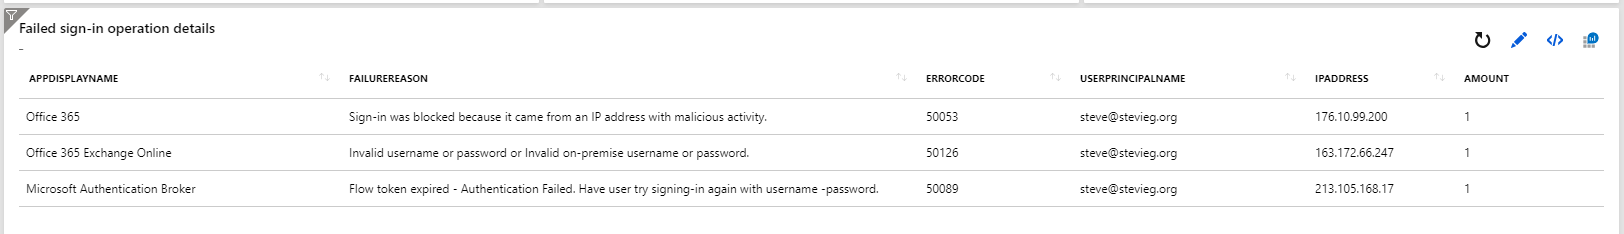
Further down on the Azure AD sign-ins dashboard, we even see more detail on failed login reasons. For example, Sign-in was blocked because it came form an IP address with malicious activity:
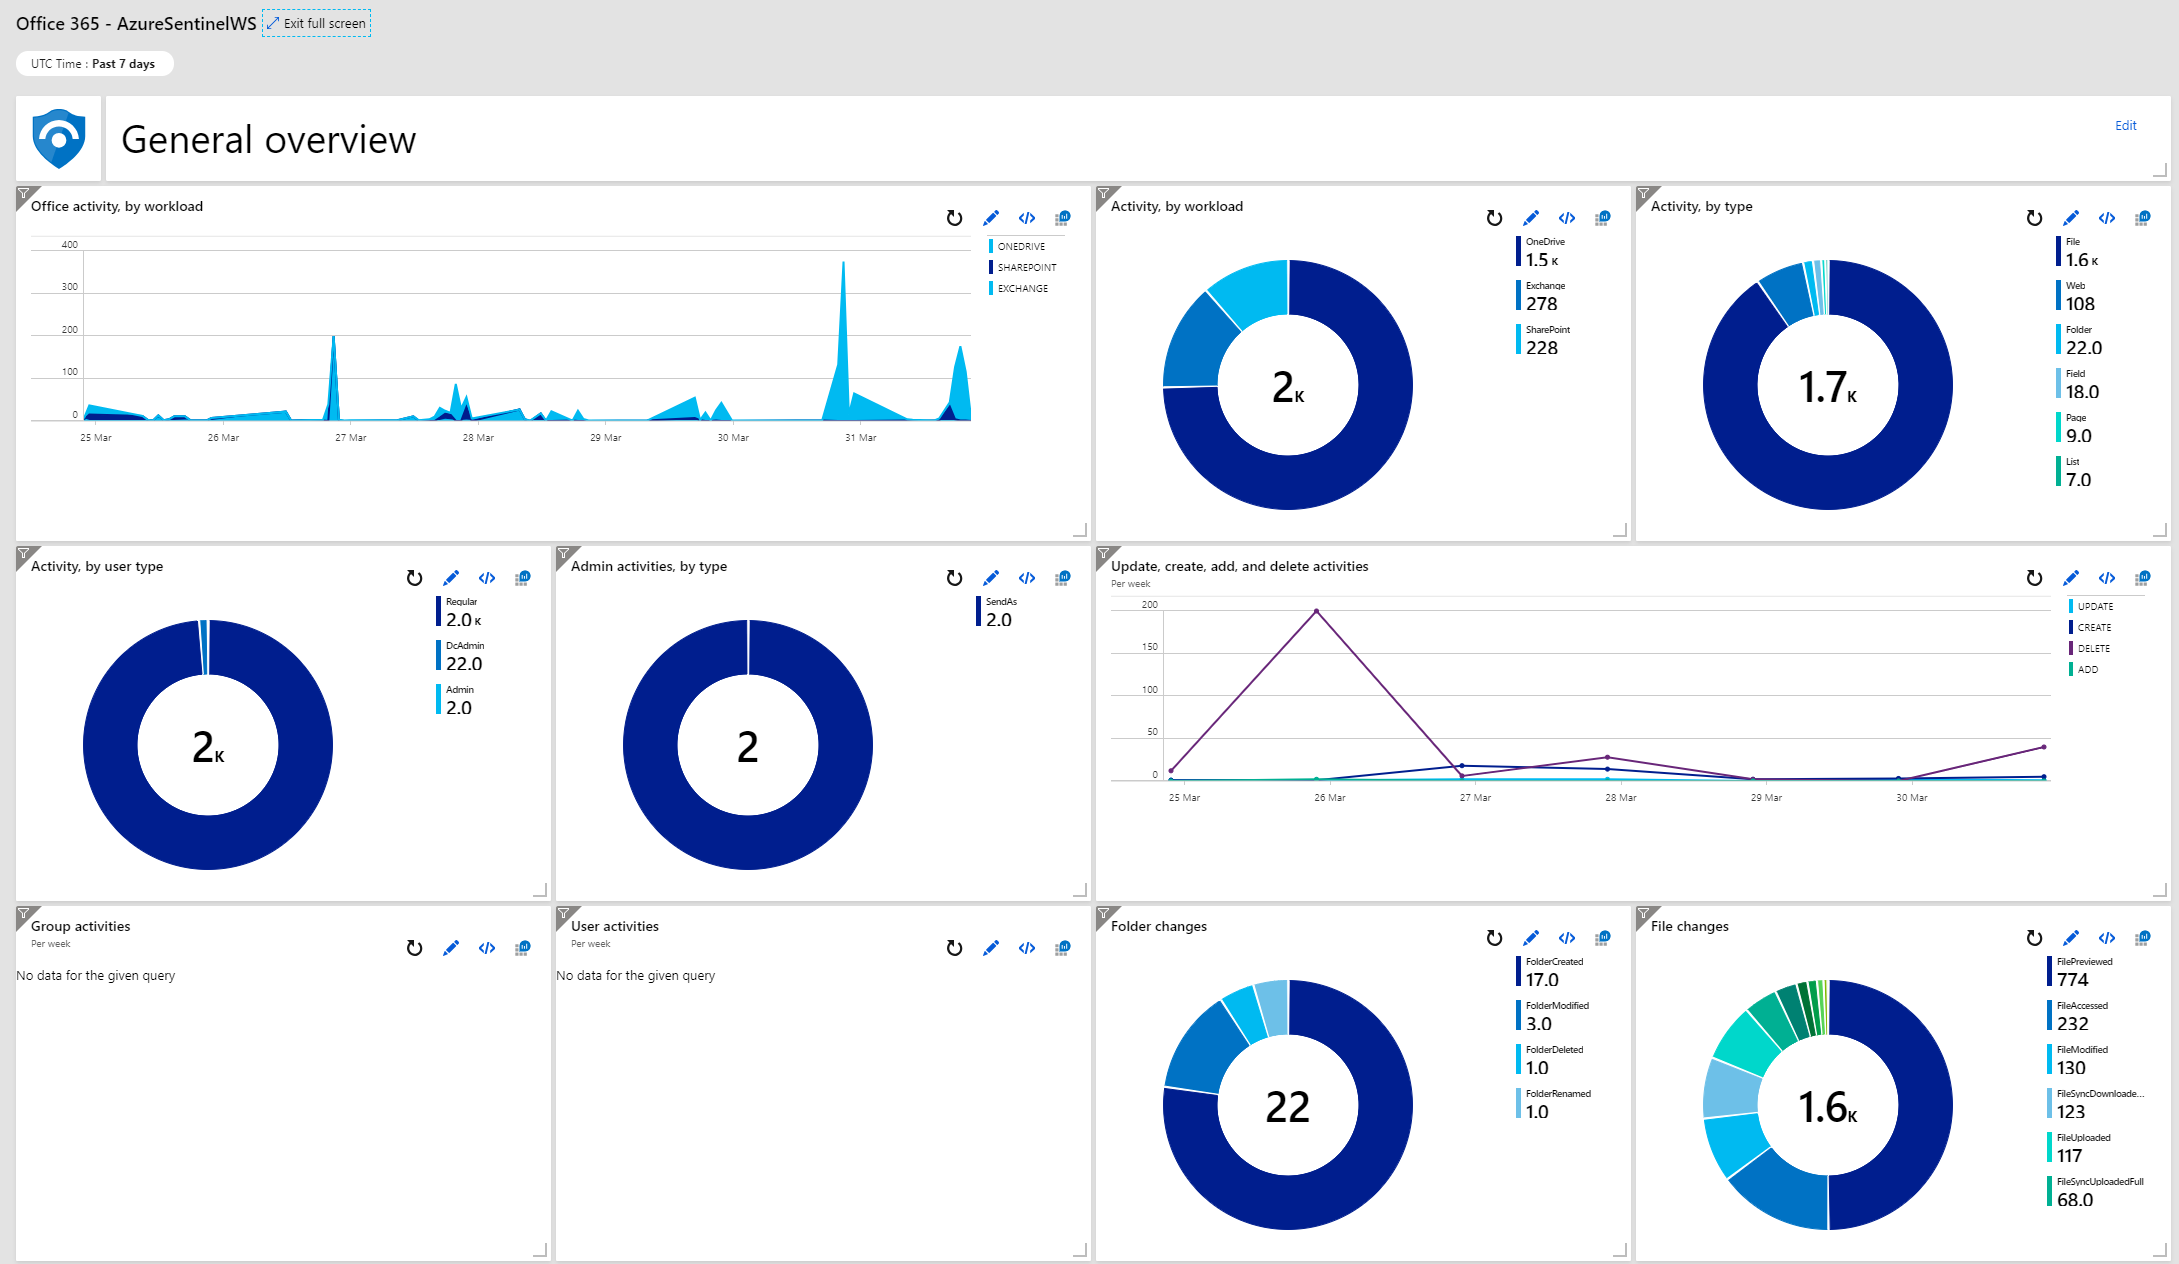
Our Office 365 dashboard provides a similar level of detail, with further breakdowns available by selecting per-service dashboards for Exchange and SharePoint. Useful information on this dashboard provides insights into not just sign-in activity, but also the type of activity whilst logged in. We can see information on changes to files, commands executed against Office 365, admin activities and cross-service creates, add, delete and update activities:
Summary
With a large array of tooling in Office 365 and EMS to monitor activity – and useful reporting services from third-party vendors – you might be questioning the need for a separate service to collate security log information.
However, a common ask for many organizations is to collate this data into a SIEM solution rather than examine the data within Office 365. Azure Sentinel is a service that allows a multitude of log types from a variety of systems to be collected and analysed in a way that will provide you with the bigger picture.
Native Office 365 and Azure integration will be a welcome addition or act as a starting point for better visibility into threats against your organization.
You may also be interested in:


do you have any idea why i cannot see mailforwarding output but only activity of admins..as our current usecase also like to trace mail forwarded to suspicious locations.
Or any suggestions how to best do this
Thanks for this Steve. Your instructions were so clear, I was able to get Sentinel set up in no time at all! Now to see what it tells me…
– Dan
I just setup Sentinel and trying to learn the functionalities. I am curious how you can dig deeper into the numbers to identify the details. For example there is a “Number of failed logons, by reasons per machine”. I am trying to find which users account for these numbers. Thanks