
Why should you build a Projects Dashboard?
When managing multiple projects simultaneously, one of the most time-consuming processes is tracking the project’s progress, assigned project managers and task completion. Usually, project related information is stored in several places, for example, the Human Resources Information System (HRIS), SharePoint, Excel spreadsheets, etc. Consequently, this makes it challenging to track and review the entire project details in one place. Therefore, a Projects Dashboard app is a good solution for overcoming these issues with project management.
In part one of this two-part blog series, we will start solving this problem by creating the Projects Dashboard v.1 app using Microsoft’s Power Platform (PowerApps, Flow, PowerBI, SharePoint) which gives us everything we need to create this application. Firstly, we will take an incremental approach and start by building a simple application today. Then, in part two, we will finish with a ready to go enterprise system.
Licensing
To develop this application, I am using an Office 365 E3 plan which includes SharePoint, PowerApps and Flow for Office 365. If your Office 365 subscription includes SharePoint Online, PowerApps and Flow for Office 365, you are fully equipped to build this application with me today.
Objectives
In this section, I am going to review the objectives of the Projects Dashboard v.1 app, so we’re clear on what we want to achieve and how.
There are two very important parts of the project. The first is the Project Managers List which contains your Office 365 users information, we will use an Office 365 connector to capture this information from the Azure Active Directory. The second is Projects List which includes the project’s details which we are going to obtain from a SharePoint list. Below is a simple diagram portraying our datasets.
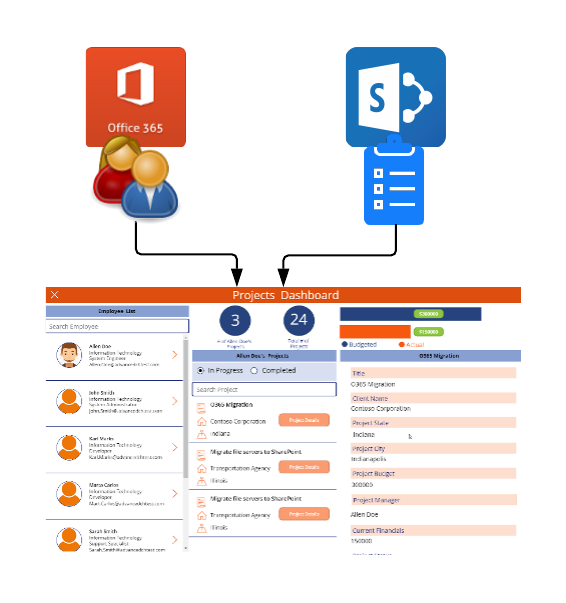
Before we dive into the development process, here is the end result we want to achieve.
All apps consist of three main components: frontend, backend, and Workflow engine.
- For the frontend, which is the user interface where users interact with the application, I will be using PowerApps.
- For the backend, where we store data for the application, I will be using SharePoint List and Office 365.
- For the Workflow engine, I will be using Microsoft Flow.
Creating the backend
Before we start creating the backend, here’s a quick review of the app’s backend in detail.
- Office 365 connector for PowerApps: All Project Managers must have an Office 365 user account in your tenant. Users can be Cloud Only or synced from on-premises Active Directory (AD). It’s very important to remember that user’s metadata (Department, Manager, Office Phone Number, Job Title, etc.) that is stored in Azure AD or on-premises AD can be displayed in your app. In my example app, I only show the Department, Job Title and UPN of the user.
- SharePoint list: Your tenant should have a SharePoint team site which is what we’ll use to create a SharePoint List to track project details.
We don’t have to do any prep work because our user information already exists in Office 365, however we do have to create a SharePoint list. If you don’t have experience on creating SharePoint lists, follow this short Microsoft documentation.
Note: You must have appropriate rights to create lists and libraries in your team site. If you don’t, you can ask your administrator to create a list and give you Edit permissions.
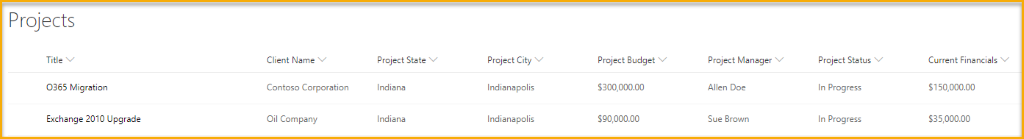
Below is the SharePoint list I created to track project details. The contents of your list columns are dependent on your business requirements. If your admin has created a list and you need to create columns, follow this document explaining how to do so. In my example, I have a SharePoint list called Projects with the following columns:
Below are the columns and their different types:
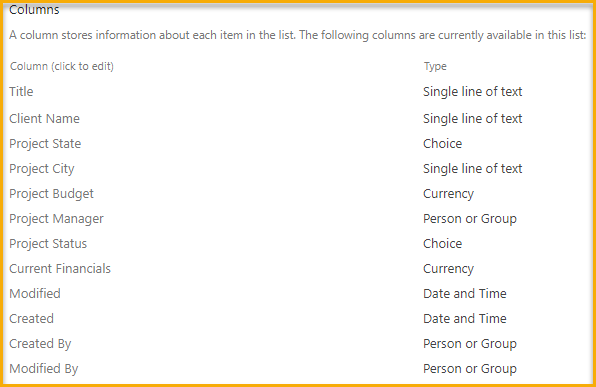
The Title, Modified, Created, Created by and Modified by fields are created automatically with every SharePoint list. In addition to this I created the Project State and Project Manager columns.
Project State is a drop-down column with 50 options to pick from, this field is more complex and handled differently in PowerApps. I will explain in further detail later in this blog.
Project Manager is a person lookup field. Using this field, you can look up anyone in your organization. Later, you will see how we connect Office 365 in PowerApps and how it relates to this field.
To get started, I am going to add a couple of projects to my list so we have some sample data. Below is a demonstration of how to add new projects to the Projects list.
Note: I would recommend adding some data to your list that you can test your app functionality.
Building the frontend of the Projects Dashboard app
The next step is to create a user interface, otherwise known as the frontend. As I mentioned earlier, we will be using PowerApps to do that.
Log in to your tenant and navigate to PowerApps platform using waffle menu icon.
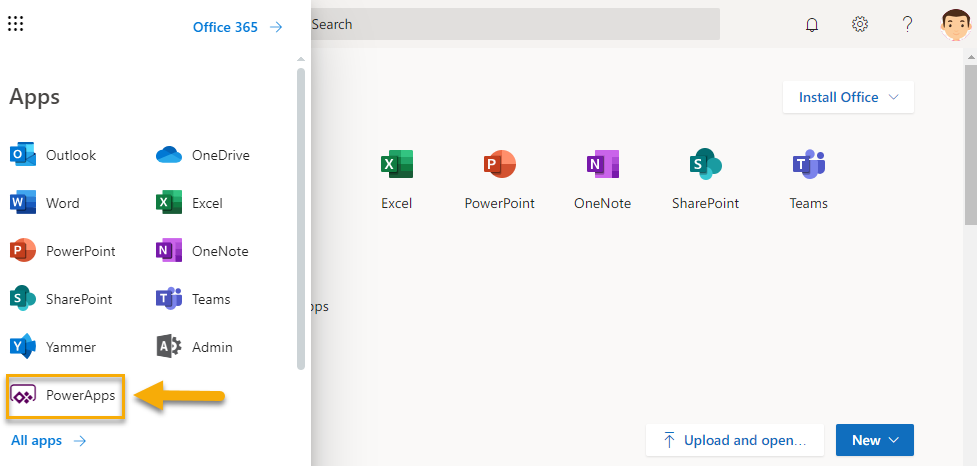
Then, you will be redirected to web.PowerApps.com. Personally, I prefer to work in a web version of the platform because it gives me more up to date features.
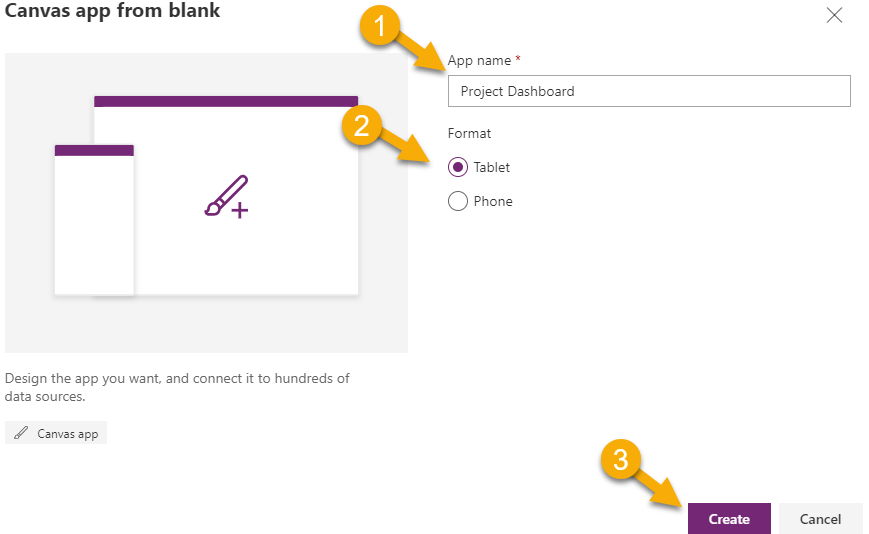
2. When in PowerApps platform, click Create and select Canvas apps from blank.
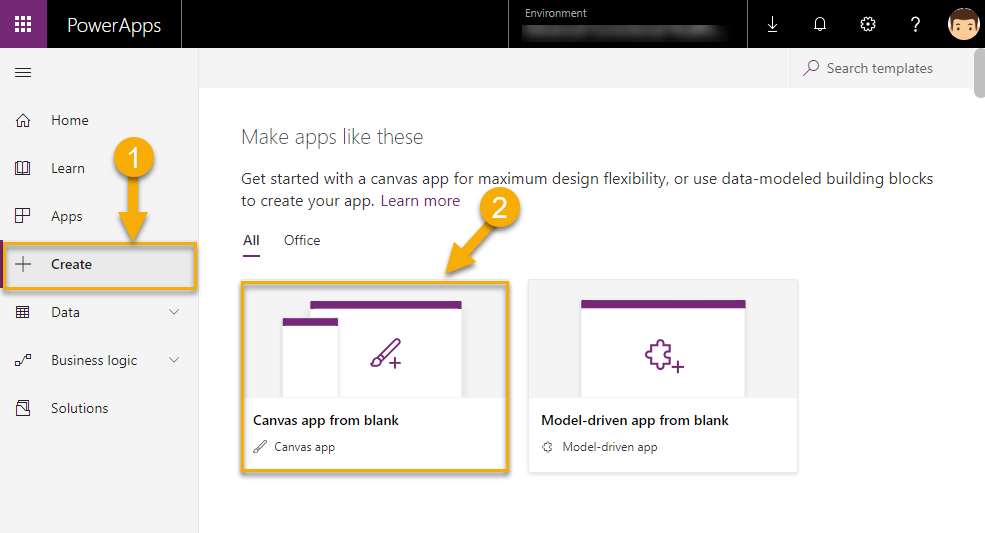
3. Select the Tablet format for this app because you’ll be embedding this app into a SharePoint page.
4. On the welcome to PowerApps Studio page you can click Skip.
Note: to help your documentation and app management, it’s best practice to rename all the elements and objects in your app. Object renaming is a simple process.
Select the object, card or screen, right-click, and select Rename. I recommend using prefixes for the names of you PowerApps objects. For example, for screens, I use “scr_” prefix.
5. I am going to rename the main screen of the app.
The Projects Dashboard screen will have three panels:
- Project Manager Search panel
- Projects associated with a project manager panel
- Project details panel
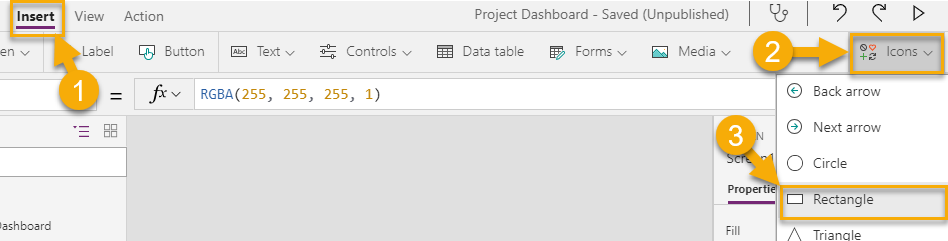
Now we need to add a header to the app and three separate sections using rectangles and text labels. In the PowerApps toolbar, click Insert > Icons > Rectangle.
Next, add labels to each header to get the below result.

After you’ve done this, we need to add data connectors, our app (frontend) needs to be pointing to the data sources (backend). We are going to add two data sources to our app:
- Office 365: List of Project Managers (Office 365 users)
- SharePoint: Project details
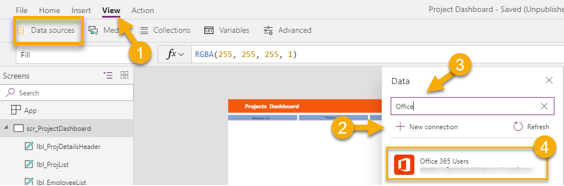
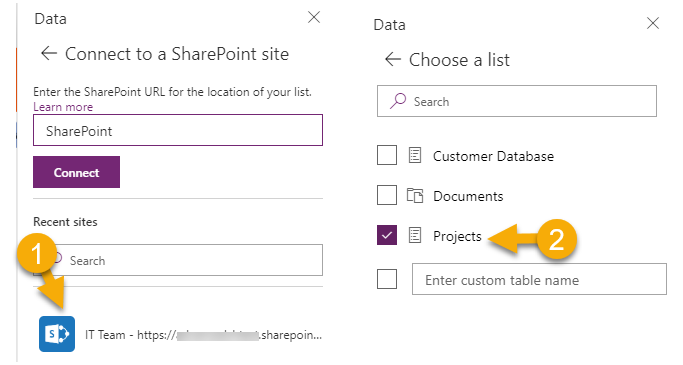
First, let’s add the Office 365 connector. To add a data source, select View > Data sources > New Connection > Search for a connector > Select your connector.
Then, repeat the same steps to add SharePoint list. The only difference here is that you’ll have to specify the SharePoint site and list.
In this step, we want to place our data in the app. If you look at the first panel on the left-hand side, we have a list of all the Project Managers. This is the list we’ll use to filter projects by individual Project Managers.
We will use a gallery to display the list of all Project Managers. Insert > Gallery > Vertical (with image).
Change the name of the gallery to gal_EmployeeList. The way you name your object does not make any difference in app functionality. However, if you want to follow this blog series, I recommend using the same names I do to avoid confusion.
Now you can create visual changes to the gallery based on your design styles such as font size and color. Please note, that all the changes you make to the gallery are made to the first item, then these are replicated to the entire list.
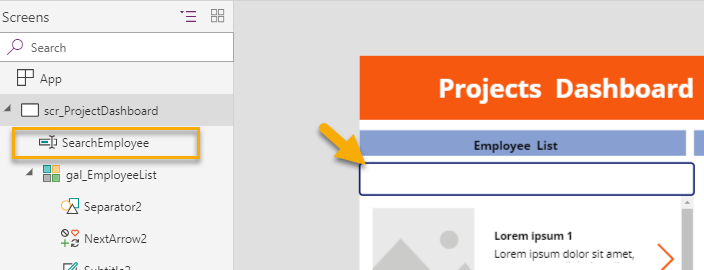
Next, I am going to place the text input box above the gallery (Insert > Text > Text Input) and use it as a search box for finding Project Managers. Rename the text input box to SearchEmployee; this will help you when you’re referencing the text input object in the formulas.
I would advise erasing default text from the text property of the text input box. This is because the gallery displays Items searched based on the keywords in the text box, so if you have it set to default, the gallery will always filter by that text.
So, now you’ve completed the stages, it’s time to connect our gallery (gal_EmployeeList) to the Office 365 data source.
Select the entire gallery, and in the Items property of the gallery insert the below formula:
Office365Users.SearchUser({searchTerm:SearchEmployee.Text,
top:10})
Formula explanation
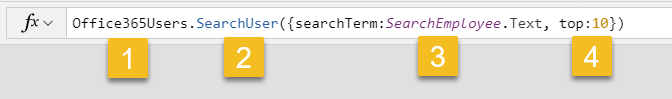
- Office365Users: Office 365 Data connector
- SearchUser: Is a function to search content in the data source which requires two parameters: SearchTerm and default number of Items to return
- SearchEmployee.Text: SearchTerm parameter that we pass to a search function
- Top:10: Returns 10 items by default
After our formula is in place, we will have to specify what Azure AD properties we will need to show in the app. In the example below, I’ve demonstrated Display Name, Job Title, and Employee Picture.
Let’s add another attribute to the gallery. I would like to show the User Principal Name (UPN). On the first card in the gallery, select one of the attributes e.g. Job Title, copy and paste this to the card and make changes to the duplicate.
See the animation below:
Add employee picture to the gallery
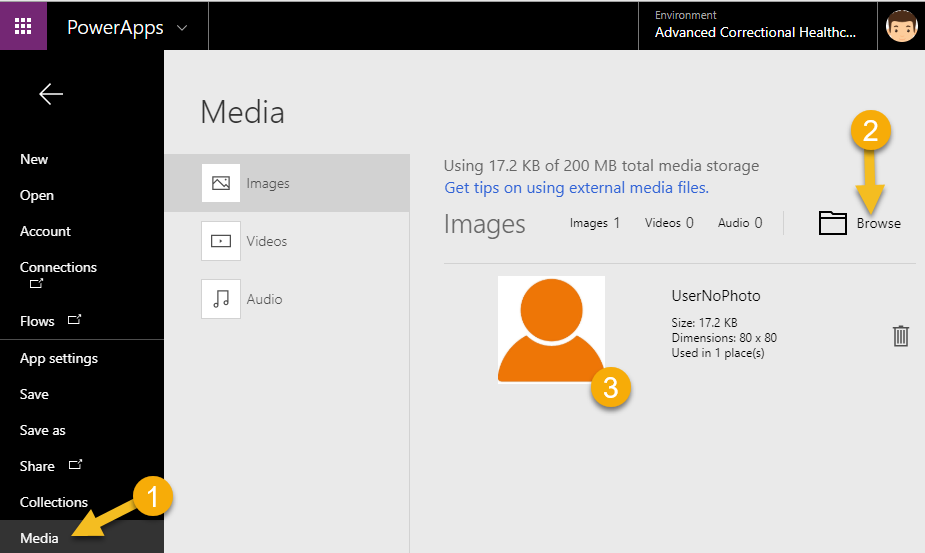
The last part of the gallery design stage is uploading a picture of an Employee. Not all employees have pictures associated with their profiles, so we also want to show a generic icon for those who don’t have a profile picture. To upload a generic image to the PowerApps media gallery, navigate to File > Media > Browse > Upload. In my case, the file name is UserNoPhoto.png.
After you’ve done this, go back to the main design area, select an image object in the gallery card and ensure you choose the first item in the gallery. Then, switch to image property and paste the formula below:
If(Office365Users.UserPhotoMetadata(ThisItem.Id).HasPhoto=false,UserNoPhoto,
Office365Users.UserPhoto(ThisItem.Id))
Formula explanation
If (‘Condition is True, THEN show ‘Generic Photo’, ELSE show ‘Photo associated with user’)
Condition: Office365Users.UserPhotoMetadata(ThisItem.Id).HasPhoto=false (user don’t have a picture)
THEN: show UserNoPhoto
ELSE: Office365Users.UserPhoto(ThisItem.Id)
To match the Office 365 user interface, let’s position the image to appear in the circle. Select the image and in the image property area set RadiusBootomleft, RadiusBottomRight, RadiusTopLeft and RadiusTopRight to 50. You may have to change the size of the image to follow your design style.
You should be able to see the top 10 Employees with their profile pictures if they have one, and a generic image if not. Here, you should also be able to search based on their Display Name.
So now we have completed building an important part of the Projects Dashboard application by bringing Office 365 data to the app. You can also use this concept to build employee directory apps for your organization.
In Part Two of the blog post, we will be bringing Projects Details data to the app and connecting it to Office 365 users.


Hi, what should I do to show in the employee galery only the employees from a certain department and having the job title project manger?
Thanks a lot,
Mircea
All is good but I can’t get the image to show. I get an error stating “invalid argument type (Image). Expecting a Number value instead.”
Please show the full line of code that you are using.
– Did you connect to the Office365 data source?
– Make sure that the object (text box, etc) names exactly match the ones I used in the blog.
Thank you
Great post, thanks for sharing! Looking forward to part 2.
Incredible post, very easy to read, tons of valuable and great information. Once again thank you for sharing your knowledge !
Great article! Thanks!
Thanks for sharing, great article. Simple to follow.
Great Post, thanks for sharing it.
Part two of the blog post will be available soon.
Looks awesome. Is there a way to get an alert when part 2 is ready?
Blog post is submitted, should be out any day. If you follow Practical365 on twitter, you should get an alert there.
Working on part 3 😉