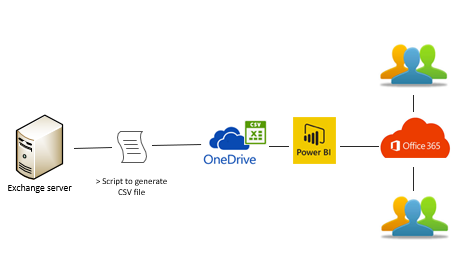
As IT professionals, we always have tasks to report on certain aspects of day to day operations. A common request for Exchange administrators is to provide information about the mailboxes in an Exchange Server or Exchange Online organization.
It’s simple enough to use PowerShell to export mailbox information from Exchange to a CSV file to read in Excel. But it is much easier to read a visual report with charts and diagrams. Executives and customers also prefer to read visual reports instead of just receiving raw data in a spreadsheet. One of the tools we can use to produce visually pleasing reports is Power BI.
Power BI is Microsoft’s business analytics service. We can use Power BI to present data in visual reports and dashboards that users can interact with. In this blog post we’ll look at how to use Power BI to build a dynamic dashboard for the CIO that presents Exchange mailbox information.
Collecting the Exchange Mailbox Data
To build the Power BI dashboard we will need to generate a dataset from our Exchange Server environment. For this purpose, I am going to use Paul Cunningham’s mailbox reporting script. The output of this script is a CSV file that is going to be used as the dataset for the Power BI dashboard.

Connecting Power BI to the Dataset
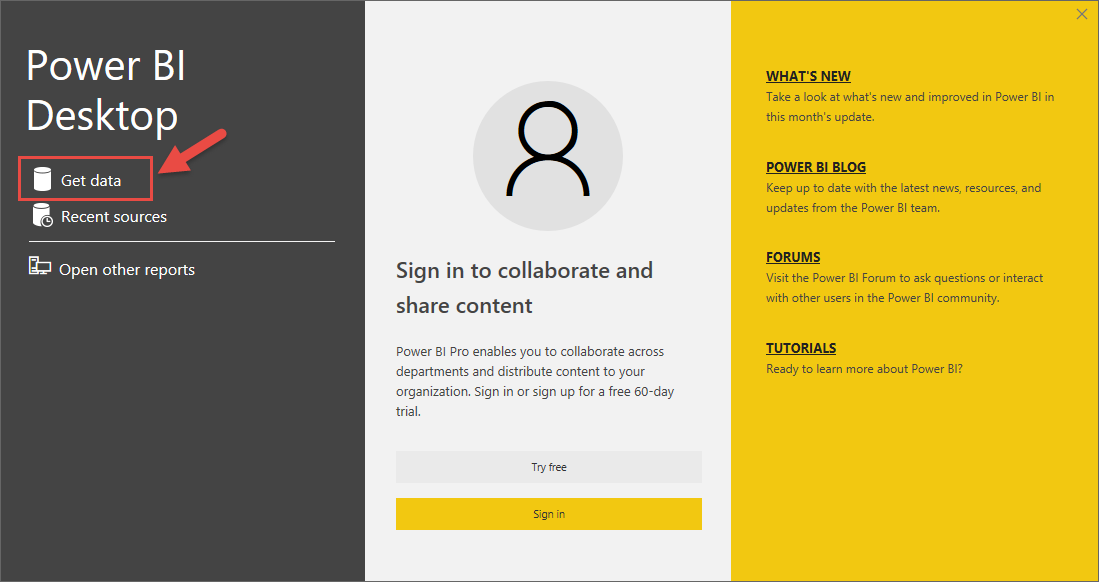
To start building the dashboard we will need to download the authoring tool called Power BI Desktop. You can download it for free from the Microsoft website, and install it on your computer.
Launch Power BI Desktop and load your data. For this demonstration the data is the CSV file produced by the mailbox reporting script mentioned earlier.
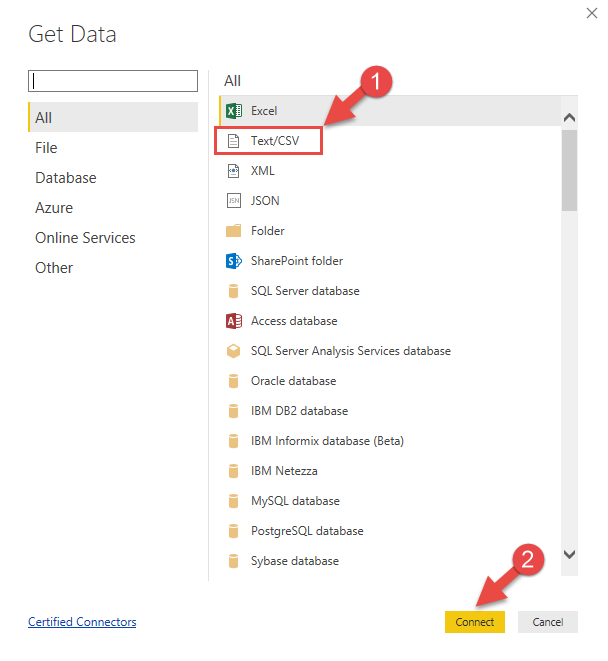
Choose the Text/CSV option, and click Connect. A file explorer dialog box will appear so that you can select your CSV data file.
Power BI detects the data type of each column based on the first 200 rows of your dataset. In my example, . Using the entire dataset for data type detection means you are more likely to find errors in the data. However, the downside is that processing of very large datasets can be quite slow.
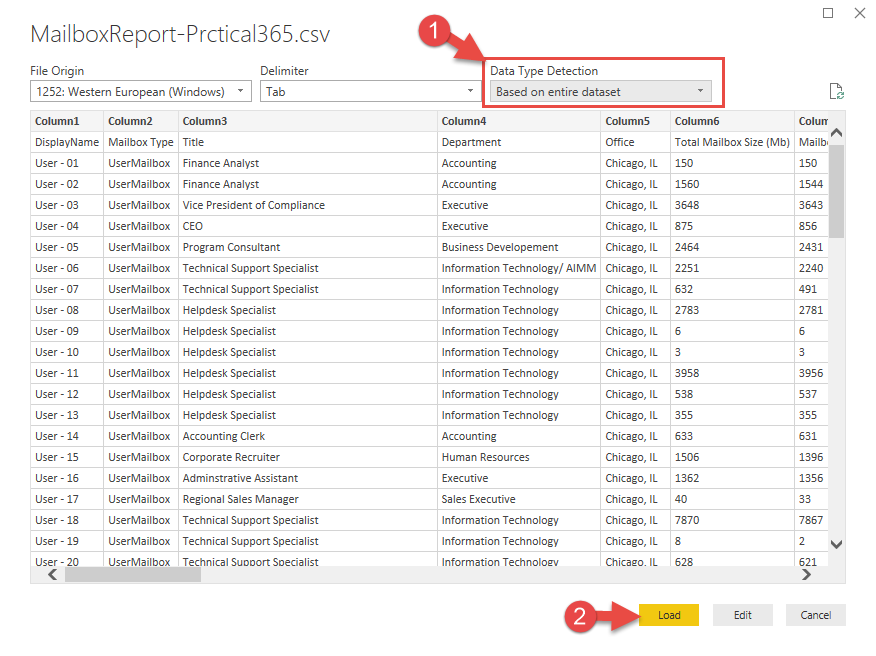
After completing data type detection, we have three options:
- Load – Loads data to PowerBI Desktop for you to start creating dashboards.
- Edit – Allows to perform data manipulations such as adding new columns, merging columns, changing data types and more. If you are familiar with Microsoft Excel column operations, this task will be very familiar to you.
- Cancel – Takes you back to the main canvas.
I am going to click Edit to shape the dataset based on the business requirements. First, I will remove unnecessary columns from the dataset. Select any columns that you do not want to use in your dataset and click Remove Column.
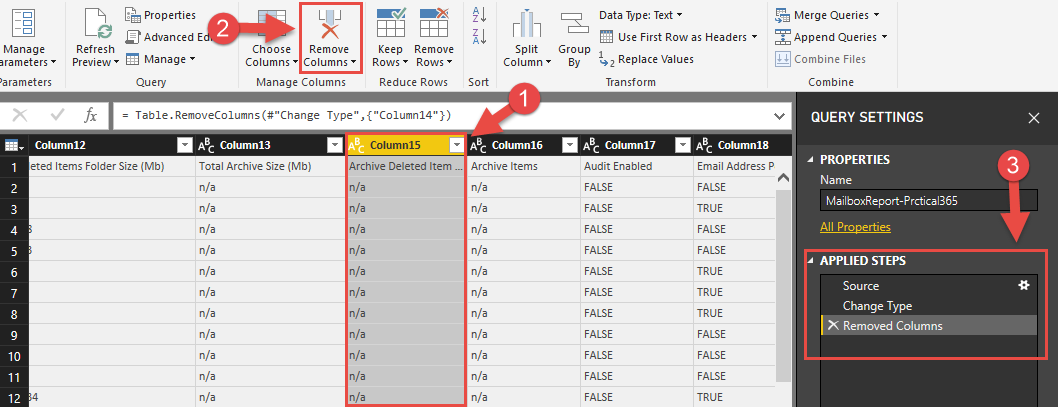
Power BI Desktop tracks all the changes that you apply to your dataset, which you can see in the right column of the screenshot above. This is a very convenient feature when you perform a lot of operations. You can also rename those operations to make it even more descriptive if you are planning to share the source Power BI Desktop (.pbix) file with someone else.
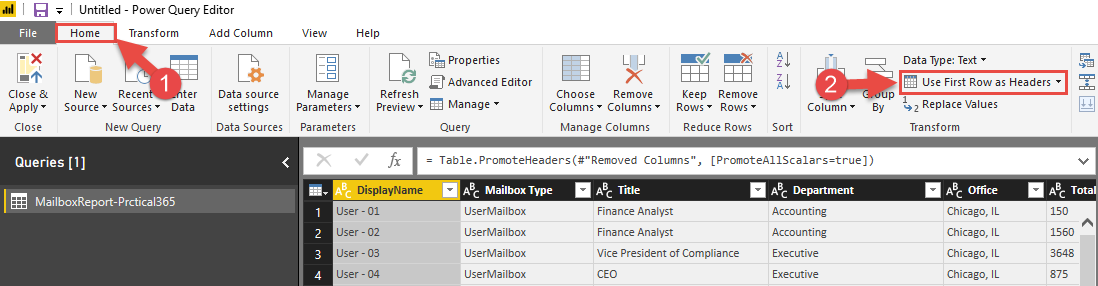
I see that there is a small problem with this dataset. The first row of this table is a column name. Let’s convert the first row of this table to an actual column name of the dataset. In the Home tab, click Use First Row as a column option.
Next, I am going to change the data type of the columns that I am going to be using on my dashboard. To identify if Power BI Desktop recognized the column’s data type correctly, look at the symbol next to the name of the column.
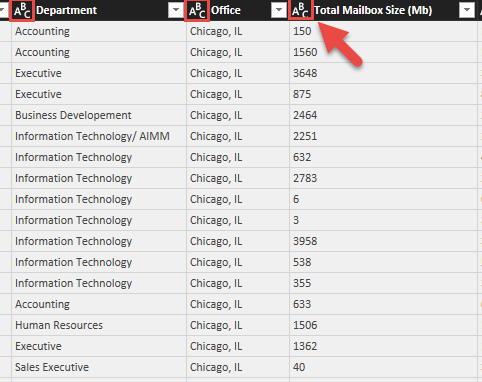
For example, we can see that Department and Office columns are identified correctly, but Total Mailbox Size (MB) is not. I am going to change the datatype of Total Mailbox Size (MB) column from text to whole number. Choose the column, click on Transform and then in the Data Type drop-down select Whole Number.

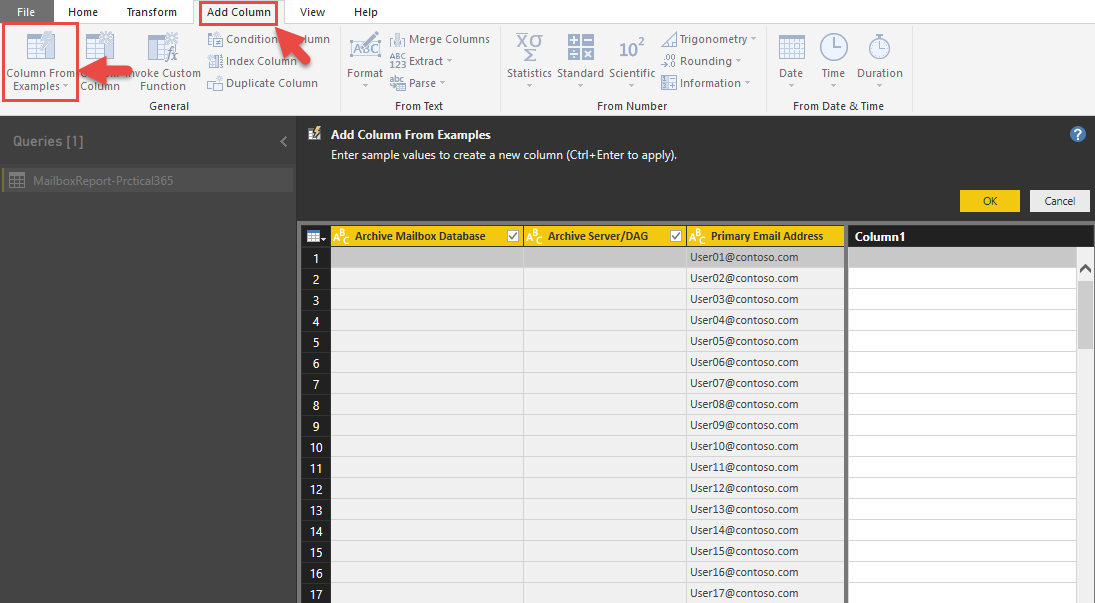
My exchange environment consists of multiple domains, @contoso.com, @xyz.com, and @practical365.com. For this example, scenario the CIO wants to see a mailbox filter based on the domain. Unfortunately, the dataset file does not have a column for the user’s domain. I am going to solve this problem using the existing Primary Email Address column and one of my favorite Power BI Desktop features – Column From Example.
Navigate to Add Column tab and click the Column From Example option.
On the right side of your screen, you will see that Power BI Desktop created a new column. Now, we will need to configure this column to show only part of the Primary Email Address column text which is everything after @ symbol. To do that, I am going to click on the first row of this new column and type contoso.com and press enter key.
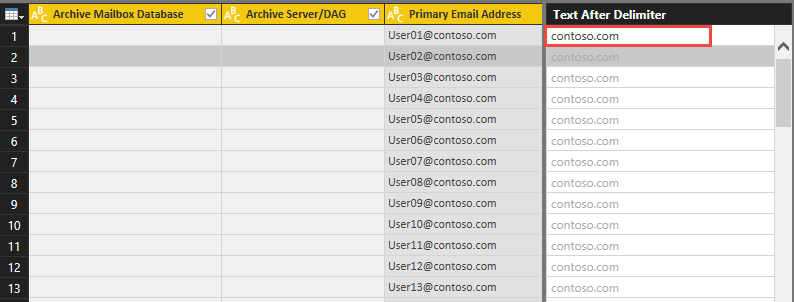
Power BI Desktop is smart enough to find a column in the dataset that matches specified criteria and populates data into the new field as required.
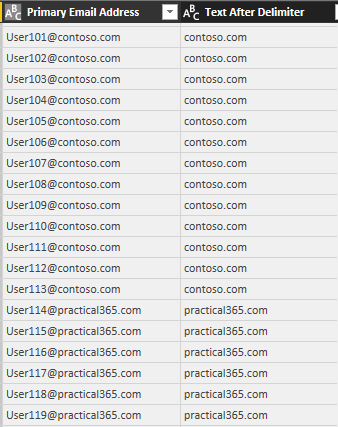
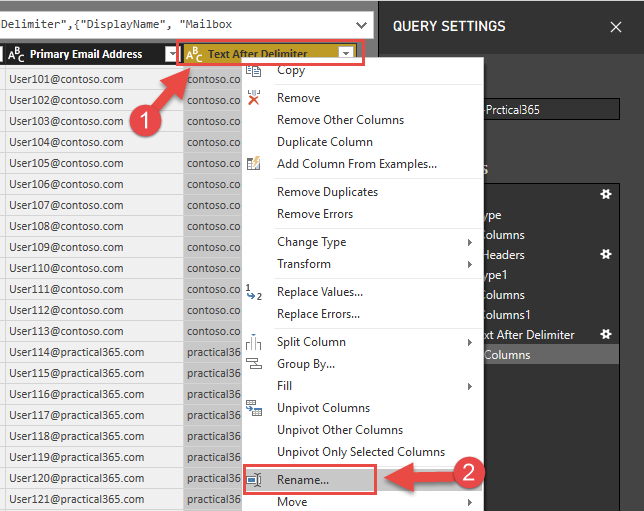
We can see that the domain name part of the Primary Email Address column was stripped and populated into our new column. For our convenience, let’s rename this column to Domain. To do that, right-click on the newly created column and select Rename and type Domain as a column name.
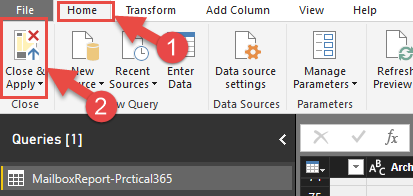
We are done shaping our data. Let’s navigate to Home tab and click on Close and Apply. Note: if you have a large dataset this operation may take some time.
If you ever need to go back and fix your dataset, navigate to Home tab and click on Edit Queries to return to query editor screen. Technically, you can replace your data source file, and Power BI will be able to run all these manipulations as long as file name and columns are the same.
Building a Dashboard Using Power BI Desktop
After completing data shaping steps, now we are going to design our dashboard.
First, I need to show a total number of mailboxes in my exchange environment. Drag the Card visualization to the canvas and select the column that you would like to perform the count operation on.
You can apply some design to the visual using the format tab on the visualization panel. Every visual has a different set of possible design options. For this demonstration I am just using manual formatting.
Next, let’s place a Pie Chart to show mailbox databases per server in the environment. To do that, turn on Pie Chart visualization, set legend to Primary Server/DAG column and values to Primary Mailbox column.
As with the earlier example, I also applied some design changes via the Format tab to make it easier to read.
Next, let’s present mailbox count per database. I am going to use a Funnel visualization to demonstrate that. There are two main settings of this visualization:
- Group – for this demonstration I’ll use the database name.
- Values – for this demonstration I’ll use the count of mailboxes (count of Display Name).
Again I am applying some formatting actions to this visualization.

Also, it is important to see the number of mailboxes per location. To do that I am going to use a stacked bar chart where I will be displaying locations on the axis by counting mailboxes per location.
Let’s apply some formatting to this visualization to make it look better.
Lastly, let’s provide the dashboard users with the ability to filter data based on mailbox domains. I am going to bring a Slicer visualization to the dashboard and set the Domain field (which is the custom field that we built earlier in this article) as the filtering variable.

When you create multiple visualizations that are connected to the same data source or multiple data sources with the linked data columns, Power BI creates a relationship between visualizations which make dashboards dynamic.
Let’s look at the final version of our dashboard; I am going to demonstrate how dynamically we can analyze our data.

Sharing the Power BI Dashboard
There are multiple ways that you can share your Power BI dashboards. Microsoft provides detailed documentation on how to share and collaborate with Power BI in the following articles:
I am going to recommend a couple of easy and practical ways to share your reports
- Share pbix file (static) – When you design your report a pbix file is created. Just save the file and share it with your colleagues as long as they have access to the dataset file (CSV, Excel, web table, etc). You can send it them in an email, or place it on a shared network drive where they can connect to it as a PowerBI data source.
- Publish to the Power BI service – Office 365 licenses include free Power BI service subscription with limited functionality. An overview of the differences between Power BI free and Pro is available here.
- Publish to Web – Publish to the web is one of the easiest and free ways to share your dashboard with external audience. Your dashboard needs to be published to Power BI service first (does not require Pro version), and then you will be able to generate HTML iframe code to embed on a web page.
For both of the publishing options your dataset file needs to be available online. A shared OneDrive folder, Office 365 Group, or a SharePoint Online document library would be suitable.
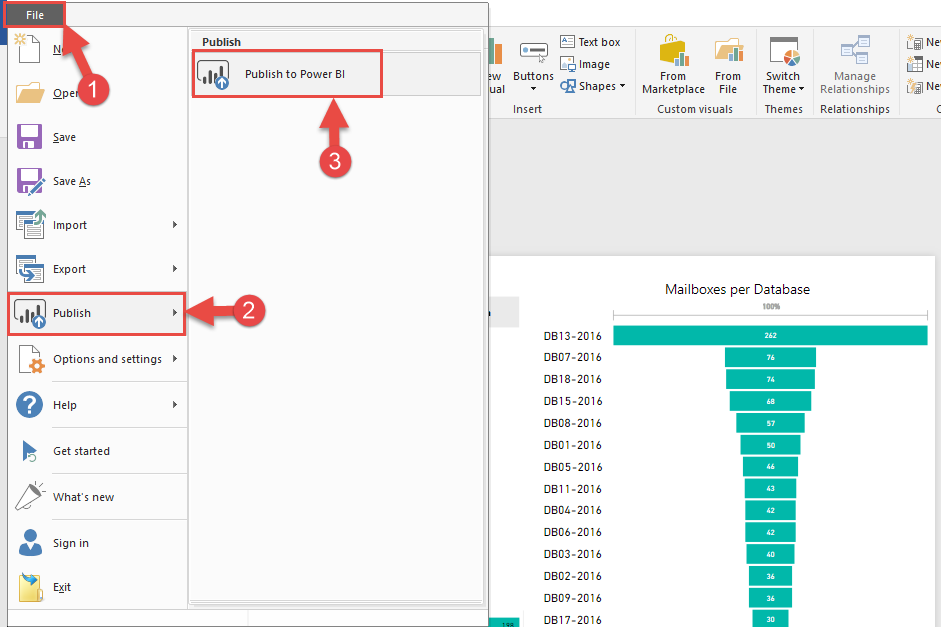
For this demonstration I’m going to publish my report to the web. As a first step we will need to publish our dashboard to the service. In Power BI Desktop, click on the File tab, Publish and then Publish to Power BI. You will be prompted to authenticate to Office 365, and your account must have a PowerBI license (free or Pro) assigned to it.
Follow the Power BI publishing prompts to publish your report to the service.
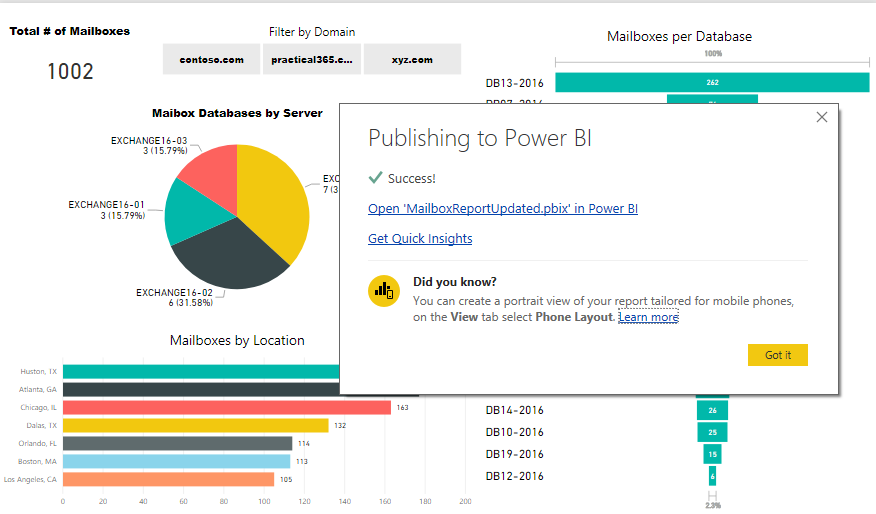
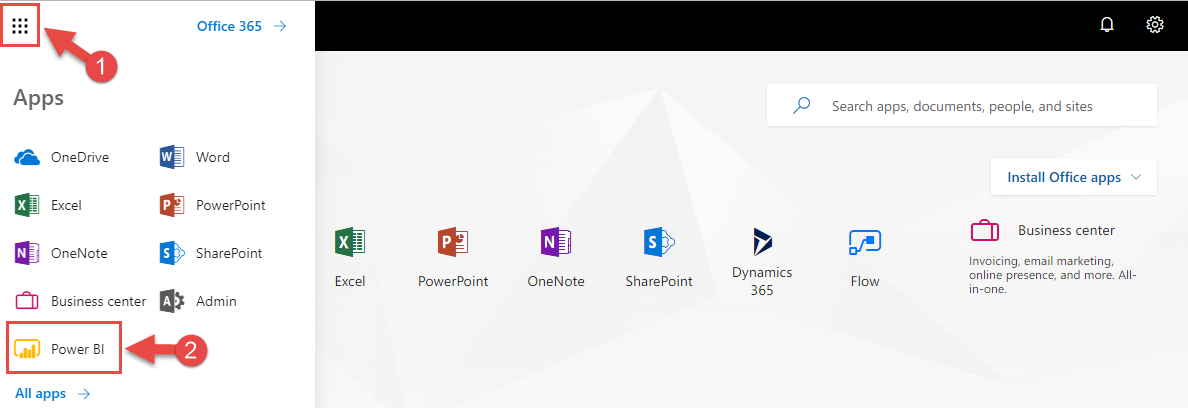
After your report is published, navigate to https://powerbi.microsoft.com and sign in with your Office 365 credentials, or if you are logged in to your Office.com account, click on waffle menu and choose Power BI.
Open your report from My Workspace, click on File and then Publish to web.
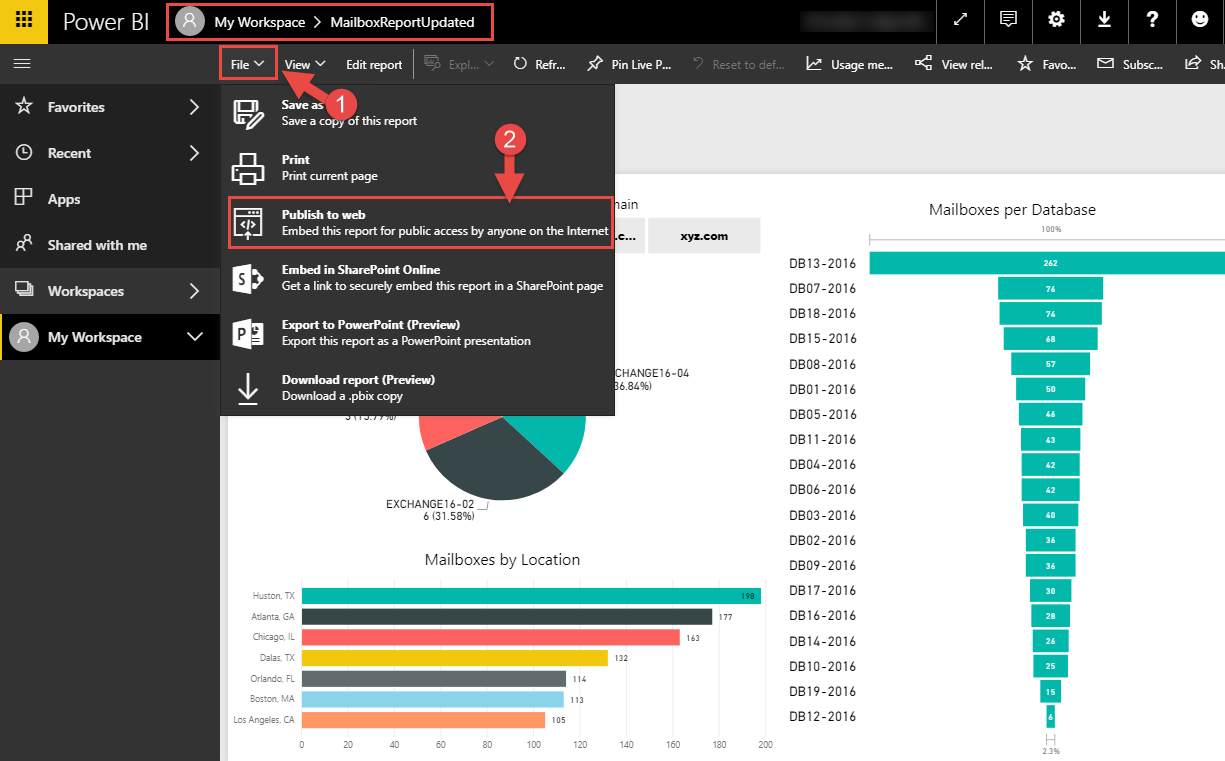
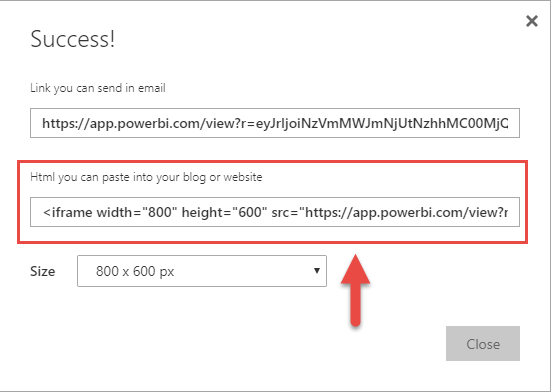
Copy the generated code and paste it to any web page that is available for you to edit. You can use your intranet webpage such as a SharePoint Wiki page, WordPress blog post, etc. Another option is to send the direct URL via email. These two options do not require Office 365 authentication to view the dashboard.
Updating the Dataset
As we designed our Power BI report to bring our CSV file to live, we will need to make sure that the output file is always up to date. There are multiple ways that you can automate this process. I am going to take the easiest way to automate this process by creating a Windows scheduled task to run the mailbox reporting script every week.
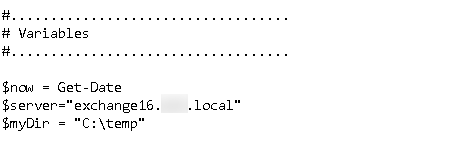
First, I am going to modify the script by hardcoding some of the values. You will need to remove this part of the script which requires passing values:

Then you will need to hardcode your environment values to the script via variables. In my environment I needed to hardcode the $server and $myDir variables.
Make sure that the output file name is always the same since your Power BI report will be linked to that file as a data source. To do that remove this part of the code:
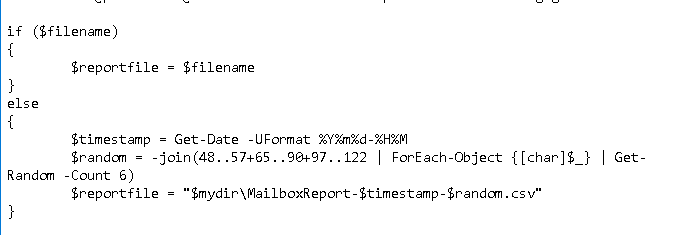
And replace with this line of the code:

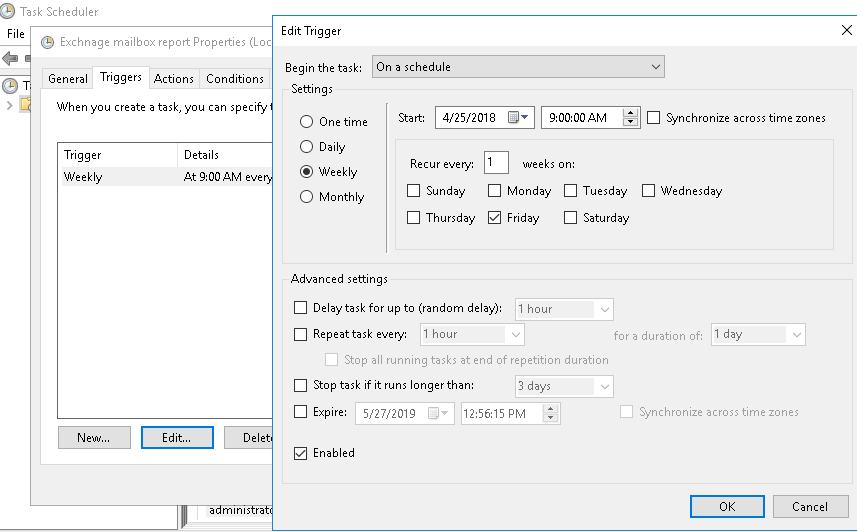
After the PowerShell script is modified, let’s create a scheduled task to run the script weekly. On a server that has the Exchange management tools installed, create a new Windows task and set a trigger as shown below.
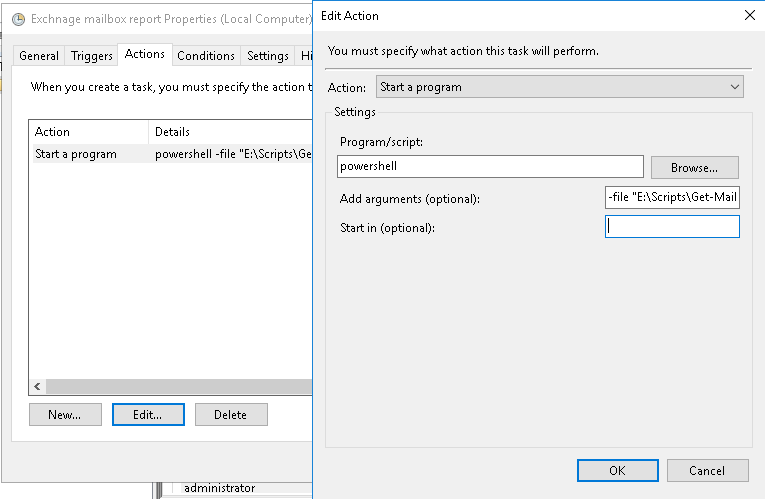
Then set the Action to run your PowerShell script, where the argument is the path to your script.
That is it; your report is going to be generated every week and Power BI services will be picking up file updates. You can either manually refresh data from Power BI Desktop or schedule automatic refreshes. To refresh data set via Power BI Desktop click More options on the right side of the panel and select Refresh Data.
To schedule a dataset refresh via Power BI service, log in to PowerBI service, navigate to Workspaces, Datasets and then click on Schedule refresh. Note that Power BI free allows manual refresh or schedule dataset refresh once a day, whereas Pro version allows to schedule it multiple times a day.


Summary
In this article I demonstrated how to use Power BI to connect to a dataset, create a reporting dashboard, and then publish that dashboard for users to access it. As you can see from this demonstration, Power BI is a great tool for turning raw data into visually interesting dashboards and makes it simple to create useful reports for your customers and stakeholders.
[adrotate banner=”50″]


I want to create power bi dasboard by uploading csv data so that i get line chart and bar chart and pie chart in my power bi dashboard and to get the power bi dasboard link so that i can open it in the browser
the above is the use case i want detailed step by step process to archive the above.
i want to archive by automatic all the process using python and power bi api
Hello,
Is there a way where I can use PowerBI to pull o365 data such as Service Status, Threats Reports, security incidents…
Thanks,
Is there any way to select limited columns from source data based on user’s request everytime (mostly dynamically selecting data from back-end based on some user parameter)
Hi,
As source data , i have to take source file every day (present in a folder created every day named as date for example C:\Users\Output\20200803\file1.xlsx , C:\Users\Output\20200804\file1.xlsx .. so on)
Then how can i dynamically pick source file in this case.
Have you guys done anything for Messaging Tracking or mailbox permissions? It seems like it might be useful
It is a possibility. There are couple of ways to achieve the goal:
– more manual method is when you schedule to run PowerShell to Export cvs and create PBI
– or use API to pull data from exchange and store it securely and build PBI
Can we switch dynamically between 2 different databases for our reports content?
Yes, it just depends how you export data. Need to know your goal.
Thanks
It is difficult to understand about connect to wordpress for beginner.
Thank you for the information! With Power BI Pro how often can i refresh the dataset, can it be real time i.e can we get the data updated for every transaction that happens, as in your example data update is scheduled every week, can we do it every minute or is there any other process. Thank you in advance
It will depend on two factors:
– since data was manually exported via PowerShell from Exchange you have to run your PS script more frequently
– PowerBI refresh info can be found here
https://docs.microsoft.com/en-us/power-bi/refresh-data
If you need more dynamic report, I would use API to achieve the goal
Hola Buena tarde!
Se puede conectar mailbox a power bi y si se puede como seria esta conexion?
Saludos
This is going to be very valuable for our management. Thanks for sharing.
Great post, as always easy to follow and self explained. Thank you !
was looking for a third party solution to do design dashboards. Tried this solution in test environment today, excited to roll it out to production next week. Thank you very much for a detailed explanation.
Tim
Hi – thanks for the post, its really interesting. The P Cunningham CSV generating ps1 you recommend does not work with Exchange Online, can you recommend one please? Thank in advance.