Disclosure – The author has been compensated to provide an honest opinion of the product in this review. You can read our full disclosure statement here.
During my career, I’ve worked in many internal operations teams. I’ve also worked alongside ops teams when I’ve been delivering projects to customers. Over the years I’ve seen a broad range of monitoring solutions used by IT departments. There’s been huge, complex enterprise systems that can monitor anything from a Unix mainframe down to a temperature sensor in a datacenter. There’s been simpler monitoring systems keeping an eye on a small fleet of Windows servers and network devices. And there’s also customers who run a mixture of free, open source monitoring tools along with a series of custom scripts (some of them written by me).
If there’s one thing I’ve learned from all my experiences it is that monitoring is hard and complex. We’re well beyond the days when monitoring was a simple as watching a server’s availability, or making sure that a service is still running. Exchange Server is a good example of how monitoring infrastructure and core applications has evolved to include measuring the user experience. We don’t care only about the availability of a server or database. We want to know that users can work productively without performance problems or errors.
Some solutions don’t provide the depth of monitoring we need. Others are so complex that it takes a specialist to set them up and maintain them. I recall one large enterprise I worked for that needed a dedicated team to manage the SCOM deployment. SCOM is complex enough as it is, but isolating it from other teams caused it to become inflexible. Getting anything added or improved in SCOM was impossible.
On-premises monitoring is difficult enough on its own. When you add cloud services like Office 365 into the mix, the situation becomes even more complex. Exchange hybrid configurations are the perfect example. Now we’re dealing with networks between our users and their applications that we don’t control or have any visibility into. With so many moving parts involved, and with many of them managed by Microsoft, it’s common for IT organisations to feel like they are losing visibility and making their lives more difficult.
Mailscape 365 is a monitoring and reporting solution designed to solve those problems. Developed by ENow Software, a California-based company with a deep history in the Exchange and Active Directory monitoring space, Mailscape 365 aims to make customer’s lives easier by enabling them to gain visibility into Office 365 and maintain awareness of the health of their hybrid environment. The product was first developed in 2012, and has evolved since then in response to the growth and change in Office 365. I took a look at Mailscape 365 to see whether it meets the needs of customers I work with and solves problems I’ve encountered in the past.
Mailscape 365 at a Glance
The first thing you notice about Mailscape 365 is that the dashboard looks nothing like other monitoring systems. There’s no donut charts, trend lines, or scattergraphs. Mailscape 365 uses a simple traffic light system to show you at a glance which services are working and which of them are not working.
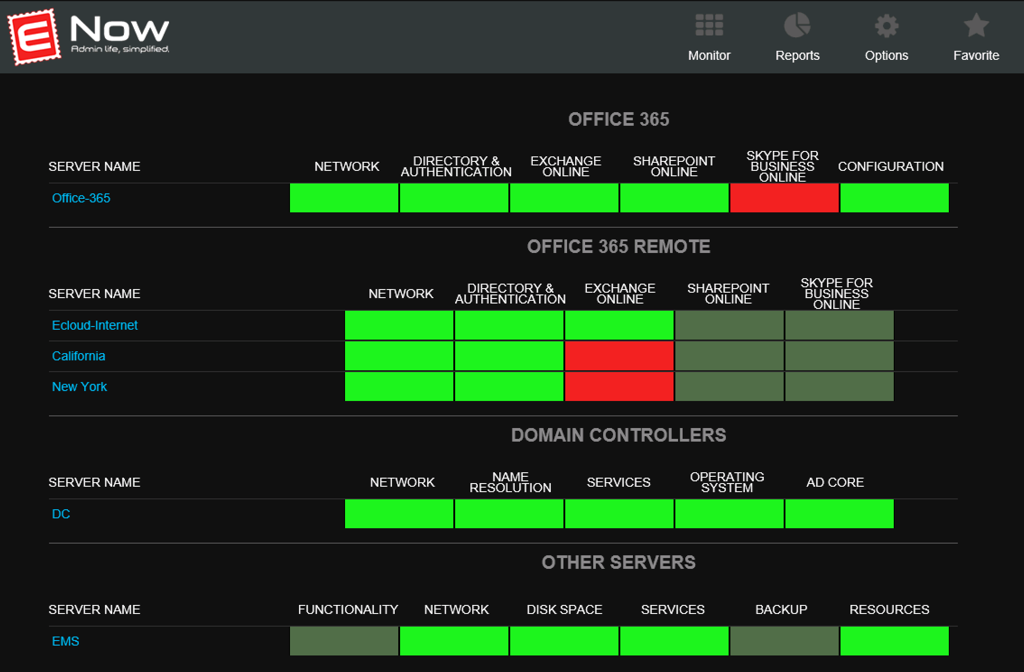
Red lights mean problems, and clicking on red lights drills down to more details. A problem with the California server in this environment is impacting Outlook functionality.
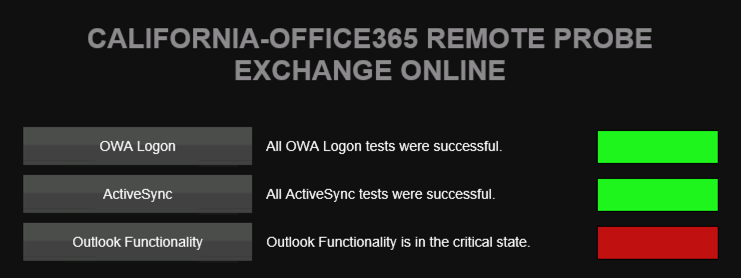
Drilling down a step further and we learn that AD FS is currently in a critical state.

Going further we discover that the MAPI client remote status test has timed out. We can draw a quick conclusion that AD FS authentication timeouts are preventing the MAPI client test from succeeding.

Troubleshooting is a process of eliminating possibilities, so I welcome any tool that speeds things up. The traffic lights and drill down let you immediately zero in on the root cause of problems. In the case above, users will be complaining of Outlook login issues, and the most likely cause will be obvious due to the AD FS alert.
Right from the start you’re able to tell whether the cause of the problem is:
- a component that you manage
- the network between you and Office 365
- a service inside of Office 365
There’s no need to wait for multiple user reports, check with the networks team to confirm their links are okay, rule out desktop performance issues, correlate user reports with their office locations, and so on. If the problem is in Microsoft’s area of responsibility, you can get that support call raised faster. The opposite is also true, in that you’ll avoid logging unnecessary support tickets for issues that are within your own infrastructure. Through casual conversation with Microsoft and other partners I’ve often heard that as many as half of all support tickets logged with Microsoft Support for Office 365 issues turn out to be caused by something on the customer’s side. I’ve logged a few of those myself, when the customer just wants a ticket raised immediately to “get the ball rolling”. But you do end up wasting valuable time raising the ticket, waiting for a call back, and walking through the troubleshooting workflows with Microsoft support reps. That time is better spend dealing with the real problem and restoring service faster.
The Mailscape 365 View of Your Environment
The above example demonstrates how Mailscape 365 monitors from a user experience perspective. For this review, I’m looking at Mailscape 365 which is designed for monitoring and reporting of Office 365 cloud and hybrid scenarios. ENow has another product simply called Mailscape which focusses on on-premises infrastructure, which I’ll be look at in more depth in a future product review.
Mailscape 365 uses three main approaches for monitoring. The first is network monitoring using tests such as ICMP (ping), traceroutes, and DNS lookups. These network tests are fairly straightforward and give you the necessary visibility into simple matters like loss of network connectivity, high bandwidth utilization, and name resolution issues.
The second approach is synthetic transactions. The alerting I looked at earlier with the Outlook MAPI test is just one example, and I’ll look closer at other examples a little later in this review. But it’s worth mention here that synthetic transactions add a lot of value to monitoring because they simulate what a real client or user will do, so they are more likely to accurately report the actual user impact of a problem.
Mailscape 365 also includes traditional server monitoring of running services, CPU performance, disk space, database backups, and so on. To collect that info, you deploy Mailscape 365 monitoring agents to your on-premises infrastructure.
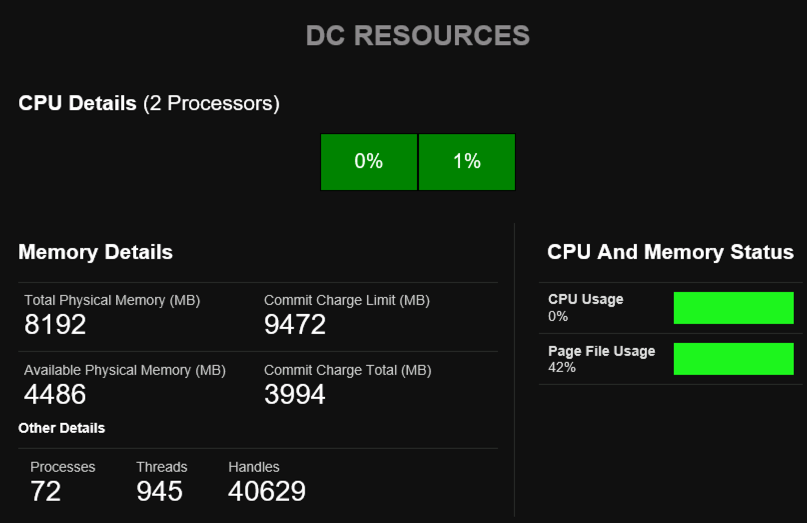
Obviously, we can’t deploy monitoring agents onto the servers that run Office 365 to check for performance problems, service status, event IDs, and so on. Therefore, the only option is to use the synthetic transactions I mentioned earlier to monitor the endpoints that our user applications connect to.
Mailscape 365 uses synthetic transactions to monitor quite a wide range of protocols and services. This includes end to end email delivery, user logins for Outlook, OWA, ActiveSync, Exchange Web Services, and other client services such as Autodiscover. Mailscape 365 also uses synthetic transactions to monitor less obvious, but equally important elements like the organization relationships and the use of oAuth that is crucial for hybrid environments to function.
The approach of using synthetic transactions is what adds real intelligence to monitoring these days. Microsoft takes a similar approach with Managed Availability in Exchange 2013 and 2016, with many probes and monitors keeping a constant eye on the health of the system. It’s how Microsoft monitors the Exchange Online infrastructure for anomalies and user-impacting issues. Pinging endpoints and watching services is simply not enough for full application-aware monitoring, at any scale.
Another problem we face in traditional monitoring is perspective. Internal monitoring is pretty straight forward. If your monitoring thinks a server is down, it’s likely down for everyone. Monitoring the cloud is more difficult. Is Exchange Online down for everyone, or only for users in one geographic location?

In the screenshot above you can see three separate views of the health of Office 365, which gives you more context on where problems are occurring. The probes running from California and New York are both reporting the same AD FS issue. If California was all green, then your troubleshooting would focus on possible causes in New York. But with both regions showing errors, you can focus on organization-wide root causes.
The probe from Ecloud-Internet, which ENow supplies, reports no issues in the example above. But the ENow-hosted probe doesn’t go to the same depth as the other two probes. For example, it checks for the availability of the Outlook client endpoint but doesn’t simulate a login. But it still provides added context, especially if you’re only able to run one probe of your own. That said, even if you don’t have multiple data centres to deploy probes to, you can install one on a Windows workstation in someone’s home, or a VM in Azure or AWS.
Location awareness is great, but what about service-specific issues? Is Exchange Online down for all clients, or only for clients connecting to a specific port?
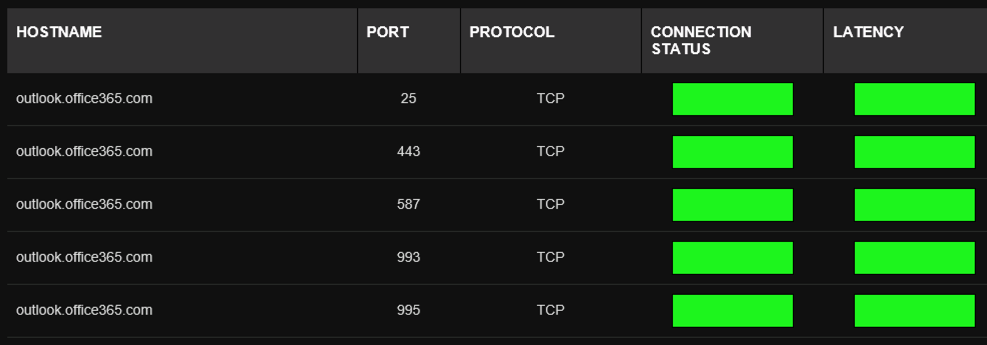
Again, Mailscape 365 gives us that granular view of how the service is performing, right down to specific client access ports. If a problem is isolated to POP, Mailscape 365 will tell you.
Who Decides What to Monitor?
As I explored Mailscape 365 I noticed options for configuring custom alert policies. That’s something that traditional monitoring systems usually have. As you’ve likely experienced yourself in the past, the configuration of monitoring systems often reflects the experiences of an operational support team within a specific environment. Over time your suite of tests becomes quite large, even unmanageable, and is full of tests for specific symptoms, not all of which will accurately alert for a real problem. The result is a monitoring system that repeatedly throws false positive alerts.
In Mailscape 365 you can tune alert thresholds, but can’t define custom probes or transactions (e.g. if you also wanted to monitor HTTP responses for your Citrix web portal). Instead of providing unlimited customization, Mailscape 365’s monitoring is focussed on its core capabilities around Office 365 and hybrid infrastructure, and is based on the experience of their product development team, which has included multiple Microsoft MVPs over the years, as well as feedback from their customers. No doubt they’ll continue adding to the capabilities in future as customers continue to make suggestions.
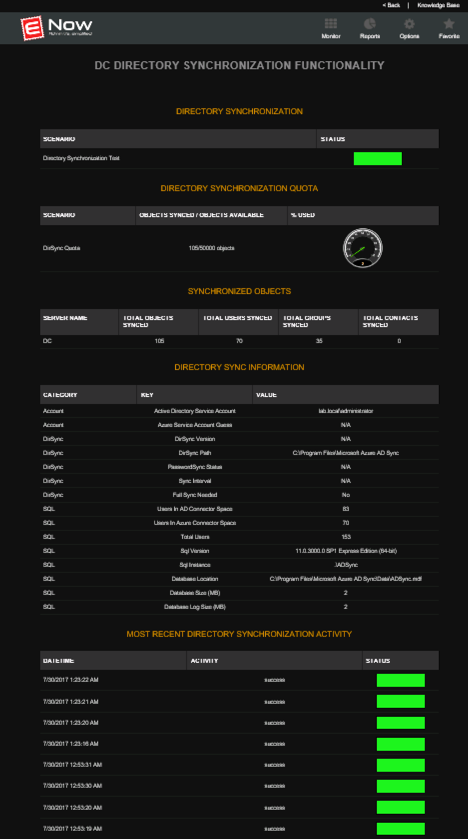
What I do notice though is how relevant the monitoring is to real world deployments. The directory synchronisation view is a shining example. It provides a wealth of information including information about:
- the number of synced objects in your tenant
- the details of your directory sync server installation (which you’ll usually need to know when logging a Microsoft support ticket for sync issues)
- a history of directory sync activity
And if there’s a problem with any of these items, it will bubble up to the main dashboard to let you know. The directory synchronization monitoring extends beyond stats and server info though, and includes synthetic transactions of its own. To ensure that synchronization is occurring, Mailscape 365 will change an attribute on an on-premises Active Directory object and then monitor the associated cloud object to validate that the change has synchronized successfully. This is a huge win, in my view, because so many frontline support issues such as timely account administration are heavily dependent on a healthy directory synchronization service.
Directory sync is obviously important, but another piece that many hybrid organizations have is Active Directory Federation Services (AD FS). For many customers, AD FS is deployed in their environment for the very first time as part of the Office 365 hybrid configuration. AD FS is used to meet their security and authentication requirements, such as being able to enforce login hours, extranet lockout policies, or simply to avoid syncing password hashes from Active Directory into the cloud. The AD FS infrastructure becomes a critical part of the environment, because user logins to Office 365 applications will fail if the AD FS infrastructure is unhealthy or unavailable.
AD FS is a tricky beast to monitor though, especially when it is new to an organization and they do not have the operational experience to manage it well. Mailscape 365 has extensive coverage for AD FS monitoring. As with other examples mentioned earlier, AD FS monitoring is enhanced with synthentic transactions to immediately reveal any user-impacting problems. And when you combine that with the remote probes we also saw earlier, you can test AD FS from inside and outside your network at all times.
But AD FS is also falling out of favour a little for new hybrid deployments, at least for customers who have fairly simple requirements that previously required AD FS. Now that Azure AD Connect is has Pass-Thru Authentication (PTA), customers can avoid syncing password hashes to the cloud if they wish, but without the complexity of a full AD FS implementation. However, in doing so, that makes the directory sync server critical to the user authentication process, much like AD FS. So Mailscape 365’s in depth monitoring of your directory sync server becomes all that much more important.
What About Microsoft’s Service Health Dashboard?
This is a good time to mention the Office 365 Service Health Dashboard (SHD). Microsoft provides the SHD as a channel to communicate service incidents and advisories to the customers. The SHD has improved over the years, with the latest incarnation having a much nicer design and providing more information that previous versions. Microsoft also claims to have shortened the time between incidents occurring and when they actually notify their customers using the SHD.
Despite the improvements, there may well be a problem impacting your Office 365 tenant, but you won’t see an SHD notification until Microsoft has multiple customer reports and has performed some initial investigation of their own. In that time, your users will be experiencing problems, and you’ll be running your own troubleshooting to identity a root cause. A system like Mailscape 365 that is monitoring your own tenant’s user experiences and endpoints has a better chance of immediately alerting you to problems than the SHD. The faster you know about a problem, the better you can communicate to your end users about it, and the sooner you can log a support ticket with Microsoft.
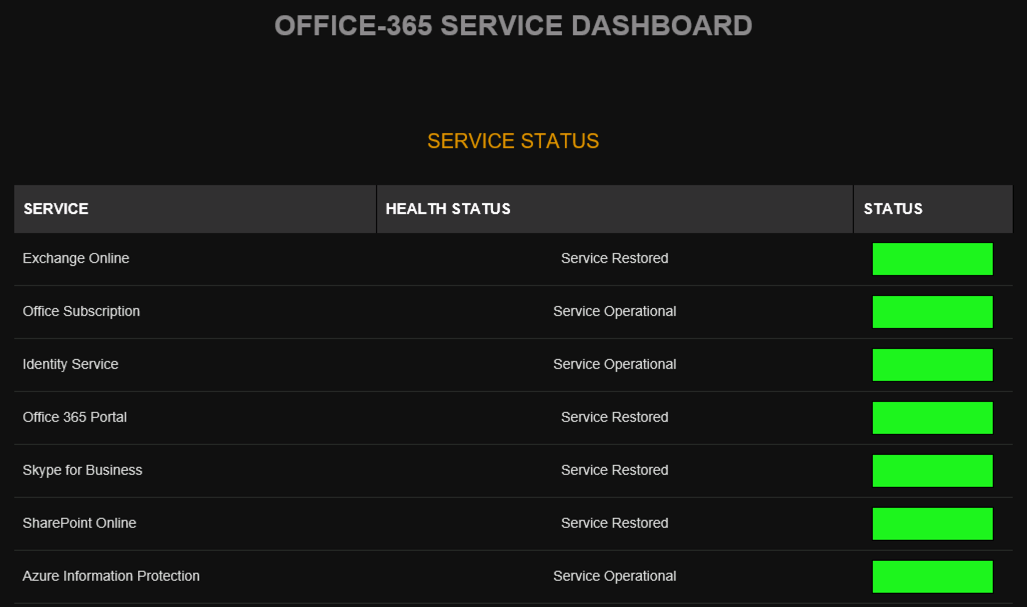
As an additional benefit, you can provide access to the Mailscape 365 view of your Service Health Dashboard without granting any administrative permissions in Office 365. Providing admin rights in Office 365 for the SHD grants more than just SHD access, which is not ideal. The Mailscape 365 dashboard is also quicker to access, no need for interested stakeholders in your organization to jump through the Office 365 authentication hoops (including multi-factor authentication, which I’m sure you would enable on their account after you grant them the admin rights needed for SHD access).
The Single Pane of Glass
A common theme among monitoring systems is trying to achieve the “single pane of glass” view of an organization. The idea is that a single dashboard can provide the best and most actionable view of what is going on with your IT systems. I don’t believe in the single pane of glass, because it usually means sacrificing accuracy and relevance for the sake of unification. It’s rare to find one solution that is best of breed across all types of monitoring. Mailscape 365 focuses on what it’s good at, which is monitoring Office 365, Exchange, Skype for Business, and related infrastructure such as AD FS and Active Directory.
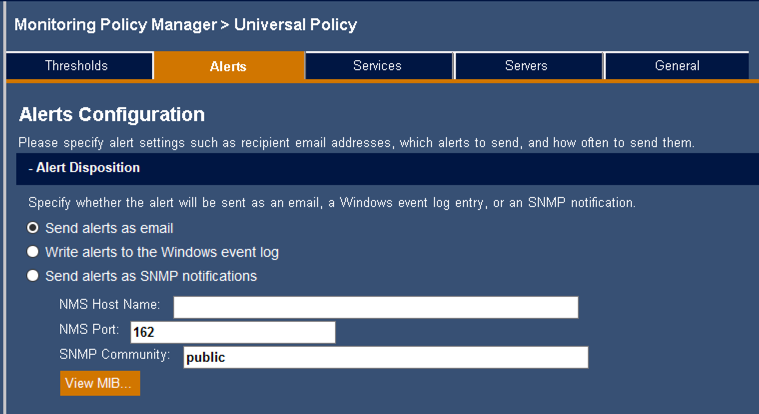
But if you do need to integrate Mailscape 365 into a wider view of your systems then you do have some options. You can configure Mailscape 365 to write alerts to the Windows event log, where they can be scraped by your other monitoring system. Or you can send the alerts as SNMP notifications to your other management systems. Email alerts are also an option as you would expect.
Mailscape 365 Reporting
So far, I’ve only discussed the monitoring features of Mailscape 365. Monitoring provides important visibility into what is happening in our systems, but it focuses on service health and availability. We also like to know things about our systems such as administrative changes, and capacity statistics. This is where Mailscape 365’s reporting features come into play.
There are 150 reports in Mailscape 365, and I’m willing to take ENow’s word on that instead of counting them myself. There’s definitely a lot of them. As with the monitoring, the reports come from the experience of ENow’s consultants and product managers, as well as the needs of their customers. Customized reports can also be created by querying the SQL database directly with SQL Server Reporting Services or any other SQL-based reporting tool that you prefer. There is also a report wizard for building reports on specific metrics and timeframes.
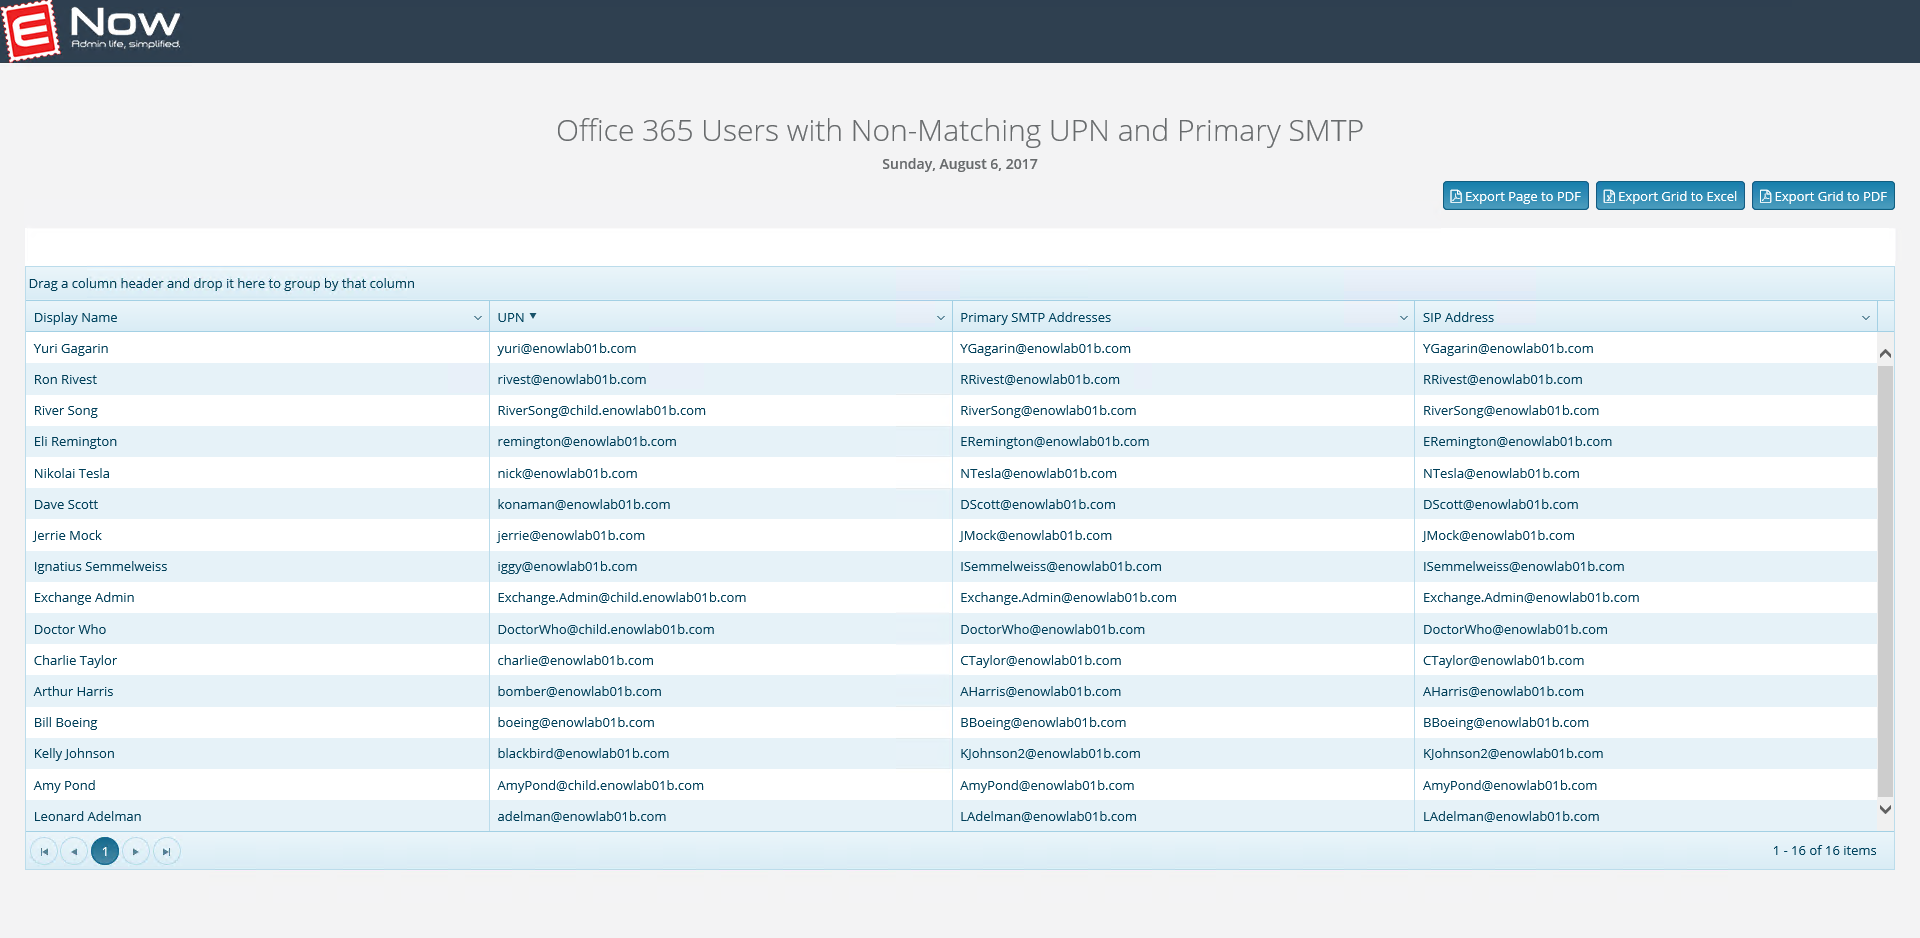
There are also reports that can help you with detecting administrative issues. For example, one of the Office 365 reports will flag users that do not have a matching UPN and primary SMTP address, which goes against best practices and causes confusion with user logins to cloud applications.
The Mailscape 365 reports are a useful mix of capacity, traffic, and the type of usage stats that help you to analyse utilisation of services. For example, you can look at usage of Skype for Business Online and identity whether more training is needed to increase adoption. Mailscape 365 reports will also help you identify inactive users, which is useful for avoiding excess licensing costs. Another report will show you the mailbox and send-on-behalf permissions, which is critical for migration planning.
When to Deploy Mailscape 365
When you consider the combined monitoring and reporting capabilities of Mailscape 365 it raises the question of when is the optimal time to it in an organization. While I think that you can add Mailscape 365 to any existing Office 365 tenant, it’s fairly obvious that there’s a heavy emphasis on hybrid deployments. Hybrid is both a migration and a long-term co-existence strategy, so it doesn’t make sense to wait for a hybrid migration to be 100% complete before adding Mailscape 365 to your monitoring toolset.
I would say that deploying Mailscape 365 during the planning phase of your cloud migration is the best approach. Mailscape 365 is cloud and hybrid-focussed, but the other Mailscape product from ENow that I mentioned earlier is on-premises focussed. I’m told that the licensing model is user based, and that deploying both products together at the start of the cloud journey provides the best of both worlds. You can make use of the on-premises Mailscape reporting to plan your migration, and the on-premises monitoring to keep the lights on while you migrate to Office 365. If long term co-existence is your plan, then keep both products running. Otherwise it’s possible that Mailscape 365 alone will satisfy your needs once you are fully migrated to the cloud and just need to keep an eye on your on-premises AD FS and directory infrastructure.
It’s also fairly clear that Mailscape 365 is a product best suited to larger customers. That’s a subjective term though, depending on where you’re located in the world. 2000 seats is large here in Australia, but could be considered small or mid-sized in the USA and Europe. I would say that complexity and impact are a better way to judge when Mailscape 365 is suited to an environment. If you feel that your troubleshooting is taking too long and costing your business from a loss of productivity, then Mailscape 365 monitoring could solve that problem for you.
What I Would Like to See Added to Mailscape 365
No product is perfect and we can always find things that need improving. For Mailscape 365 I would like to see the scope of coverage in Office 365 services expanded. Currently there is monitoring included for Exchange Online, SharePoint Online, and Skype for Business Online as the three main pillars. OneDrive for Business is not included in monitoring, although as a SharePoint-based service it shouldn’t be too difficult to add it. OneDrive is included in the Mailscape 365 reports though.
Newer cloud applications such as Teams and Planner are neither monitored nor are there reports available for them. I suspect demand for inclusion of these applications will increase as general adoption increases. At a minimum, the client endpoints for the applications could be added, followed by reporting (e.g. Teams utilization, Groups managers and owners, inactive Planner plans, etc.), and then more detailed monitoring added later as the different fault scenarios become more apparent.
I would also like to see some expansion into more Azure-based services. The Intune DNS records and endpoints for device enrolment is one such example. That said, a lot of this external monitoring and reporting depends on Microsoft adding capabilities to the Graph API, which is still fairly new and has a lot of development planned in the future.
Conclusion
All in all, I consider Mailscape 365 to be an excellent monitoring and reporting solution for Office 365 cloud and hybrid customers. The monitoring capabilities are relevant, easy to navigate, and easy to interpret for troubleshooting. It’s a refreshing change in a landscape of complex and cumbersome monitoring products.
Try Mailscape 365 yourself for free with a 14-day trial.




Pingback: Review of Mailscape Exchange Server Monitoring from ENow Software