Identify Problems in Public-Facing Infrastructure
It’s important to protect public-facing infrastructure because threat actors often exploit public-facing resources. In recent years, several major vulnerabilities appeared to affect public-facing resources such as Log4J, Ivanti’s VPN appliances, and Palo Alto firewalls. A vulnerability in a public-facing resource is much easier to exploit for a threat actor because an attacker doesn’t need physical access to the network. Instead, the attacker can exploit the vulnerability over the internet. This is why most major exploitation campaigns use this type of vulnerability.
To cover the risk, public-facing assets must be scanned continuously to discover what resources are public-facing and if vulnerabilities reside in those resources. Once that knowledge exists, patching can be started.
Information is key. I have encountered scenarios where a customer has no idea what resources are exposed to the internet. This is a major issue as you cannot protect what you don’t know. That is where Microsoft Defender’s External Attack Surface Monitoring solution comes in.

What is External Attack Surface Monitoring?
Microsoft first released External Attack Surface Monitoring (EASM) in August 2022. However, the product is much older. EASM originates from Microsoft’s acquisition of RiskIQ, a well-known security company that had existed for decades. An external attack surface monitoring tool scans the external network, creates an inventory, and identifies security issues.
MD EASM is managed using the Azure Portal and is billed using Azure subscriptions. The billing is based on identified assets. Only IP addresses, hosts, and domains are billable assets and there is a monthly price of $0.33 per asset.
The scanning system is an intelligent service that uses multiple probes across the internet to map resources. These probes are fully managed by Microsoft and are not visibility to us. You start by building a discovery group of everything you want to scan. This can include IP addresses, DNS names, email addresses. Based on the group settings, MD EASM identifies resources. The service also looks for resources that are related to the ones specified in the inventory. This is best explained with an example:
- An IP address is added to the discovery group.
- Associated websites are identified.
- DNS details of those websites are registered.
- Based on the DNS email contact, other websites can be found.
Because the scanning system is dynamic, it can identify shadow IT as there are often public resources which are unknown to the IT team. This is the case when somebody from the marketing department might have enabled certain PaaS tools, without informing the IT team. By adding organization terms in the discovery groups, EASM can identify those resources and provide them to the IT team.
Based on the discovery group, MD EASM creates an inventory. The inventory lists the associated resources identified and information about components, open ports, and vulnerabilities. Using the inventory, an organization can identify public-facing resources and their vulnerabilities.
Creating a Discovery Group
To get started, a discovery group must be configured. It is possible to configure multiple discovery groups. I recommend this approach in order to keep it manageable and clear what discovery group is connected to what assets.. As a general rule, I create a discovery group per physical location and entity (if the organization consists of multiple operating units).
There are two different ways to create a discovery group:
- Microsoft has predefined configurations for organizations. The configurations are based on public information Microsoft retrieved from the internet. This function is hit or miss. Not all companies (even bigger ones with a headcount of 10K+) are listed. As an example, Quest Software Inc. is found together with its associated domains (such as kacecloud.com, oneidentity…). After adding a predefined organization, it is still possible to tweak the discovery group based on your requirements.
- If your organization is not identified, you can add details manually. As mentioned in the example, you don’t need to fill out everything. I have found that IP addresses and domains are enough to build an adequate inventory. Other details such as WhoIs information and email contacts are typically identified based on the IP addresses and domains.
For each discovery group, the scanning frequency must be configured. There are only two options: weekly or never. I tend to default to a weekly scan as pricing is not affected by the selected frequency.
Working With Assets and The Inventory
After the discovery phase finishes, the inventory is filled with assets. There is no predefined time when the discovery run will be complete. In my experience, discovery typically requires a couple of hours.
At this point, we can navigate through the inventory and examine individual assets. If we select an asset, the portal displays a detailed view of its configuration (Figure 1).
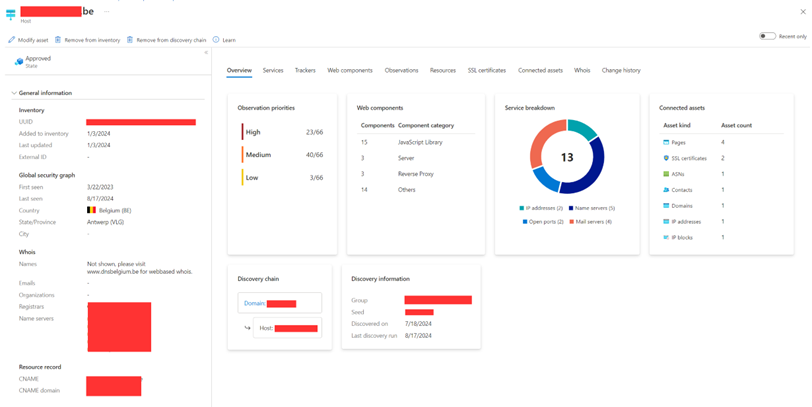
Within the asset overview, I find the most valuable information in the following tabs:
- Services
- Information about mail servers, name servers, and ports. The most interesting bit is the open ports. Here you can see what ports are open to the internet. This is interesting information as it dictates the attack surface. All services behind these ports can be easily exploited over the internet.
- Web Components
- Web components (including their version) are active on an asset. This includes operating systems and web servers, but also the hosting provider, JavaScript Libraries, and coding frameworks.
- Observations
- Observations loosely translates to vulnerabilities. If there is a security risk, it will be listed here.
- Change History
- Within the change history, a list is shown with all changes to the asset. The change history tracks changes, even before you have added something in your inventory.
It is important that someone takes ownership of the inventory and decides what assets are in scope. Because of the scanning mechanism, the amount of assets can quickly explode. If an asset is not interesting, you can update the state which enables you to set an asset as non-billable.

Getting Insights
There are two ways to get insights from EASM scan results: the built-in dashboards or custom reports.
There are 6 different dashboards to give a high-level overview of all the data collected. Figure 2 is an example.
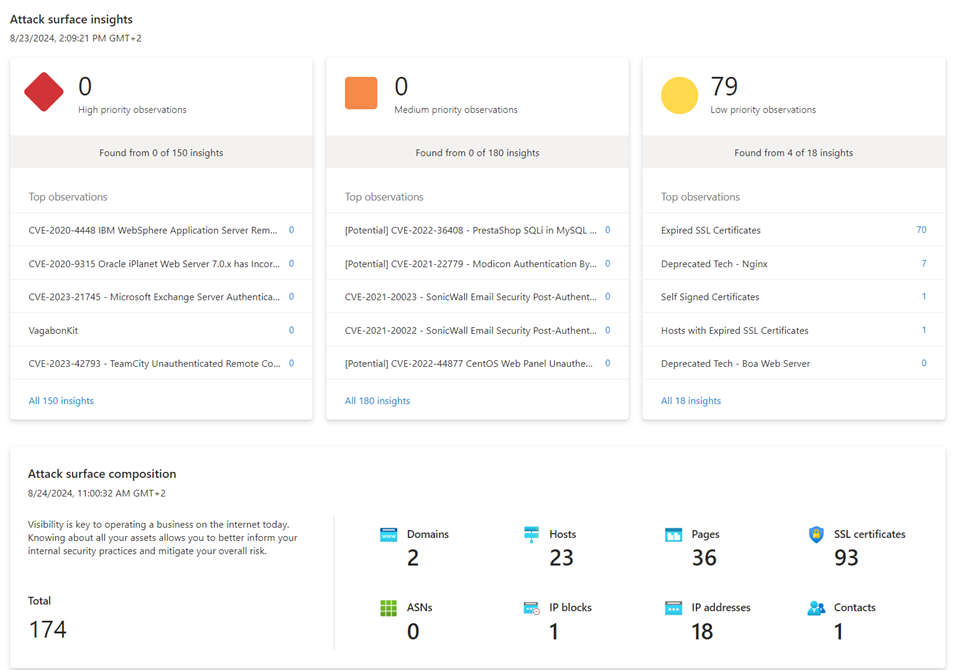
While the dashboards provide a summary, they lack actionable items such as:
- What are the most important open ports?
- What are the critical CVEs?
- What is the machine with the most CVEs?
During customer engagements, I always create custom reports as MD EASM makes it difficult to get the required data out of the built-in reports. The built-in reports are not easy to use and require you digging through multiple pages.
To create custom reports, I use Log Analytics workbooks which support the creation of visualizations based on KQL. To make this possible, the data needs to be exported using a data connection.
Afterwards, the EASM tables are in Log Analytics and it’s possible to create custom reports. Microsoft provides a template workbook to get started.
Comparing EASM to Defender for Endpoint
A question I often receive is how MD EASM compares to Defender for Endpoint (MDE). MDE also identifies vulnerabilities and can identify internet-facing devices. There are several differences:
- MD EASM supports identifying public-facing resources independent of the platform. The feature within MDE only supports Windows-based machines.
- MDE requires devices to be onboarded before it can see the devices. This creates a gap as MDE is not available on certain appliances such as firewalls or PaaS resources like Azure Web Apps. MD EASM doesn’t require an agent and can discover a wider range of devices.
The main downside of MD EASM is its lack of integration within the bigger Defender XDR stack. While it integrates with Exposure Management, MD EASM has a separate UI and does not share a dataset with MDE and MD EASM. These gaps create the need for custom integrations.
Getting Insights
Microsoft Defender External Attack Surface Monitoring is a powerful tool to help organizations understand risks that might exist within their public-facing exposure. This angle is not covered by other Defender products. MD EASM has powerful scanning and discovery capabilities to find assets. On the downside, the lack of integration with the broader Defender XDR suite and inadequate built-in reporting are both obvious. However, this is a relatively new product in the Microsoft Security stack. One can only hope that MD EASM will improve over time.