SharePoint Online, the SharePoint version available in Office 365, is the Microsoft cloud collaboration tool and the base for several other Office 365 services, for example, Groups, Microsoft Teams etc. On the other side of the Microsoft cloud spectrum, Azure offers quite a lot of services for IaaS (Infrastructure as a Service), PaaS (Platform as a Service), and SaaS (Software as a Service) that can be integrated with SharePoint, aggregating extra functionality that is not available natively in the system. One of the Azure services is the “Azure Monitor”, which includes the “Log Analytics” and “Application Insights” subsystems, that provides tools for gathering and analyzing the telemetry of online and on-premises resources and applications.
Application Insights screens the readiness, performance, and usage of web applications, hosted in the cloud or on-premises. It provides insight into the application’s operations and can also diagnose errors as well, without waiting for a user to report them (using the Alerts mechanism of the service). Dashboards combining the gathered data can be created to show different kinds of metrics, and Power BI could eventually be used for visualization and making the data available outside the organization. Azure Logic Apps allows you to automate information from the Monitor, creating workflows that integrate with other systems (Email, for example). Finally, Azure Monitor contains multiple APIs to read and write metrics and to access generated alerts in a customized form.
Although SharePoint 365 provides a general statistic and analysis service for the tenant, connecting the “Application Insights” part of the Azure Monitor with SharePoint could be very interesting, allowing to get more specific, localized information about one page or one SPFx WebPart.
Create and configure the Azure Monitor service
To create the Azure Monitor service, you need to have an Azure account (it is possible to get a trial account from Microsoft).
Step 1. Open the (https://portal.azure.com) and log in using an Azure Administrator account
Step 2. Create a “Resource Group” (or reuse an existing one) to contain the Azure Monitor service. Provide a name for the group, select the subscription name and the datacenter location to be used.
Step 3. Open the Resource Group and click the “+ Add” button. In the search box write “application insights” and click on “Application Insights” in the list. A new window will open with some information about the service. Use the “Create” button.
Step 4. Give a name for the service (“MonitorSPFxWebPart” in the following example because we will use it to monitor the use of one SharePoint WebPart). In the “Application Type” select “ASP.NET web application”. Select the subscription and Resource Group to be used. Then, “Create” the service
Step 5. After creation, go back to the Resource Group and open the service. The main configuration on the left side and the dashboard will be visible (we will take a close look later). Take note of the “Instrumentation Key” that is shown in the “Overview” panel, on the upper-right corner, we will need it later. In principle, the service is ready to be used, and waiting to receive information from any kind of web application that connects with it (because we configured “ASP.NET web application” in Step 4)
The SharePoint SPFx WebPart
We are aiming to get monitoring information from one SharePoint SPFx WebPart for this example, but you can use the same Azure Monitor service to gather information from several WebParts and/or Add-Ins simultaneously. It can also be used to monitor SharePoint pages and SharePoint on-premises farms, as long as they can be reached from the Internet.
Step 6. For this example, we will use the default “Hello World” SPFx WebPart that you get if you run using all out-of-the-box configurations (I use a JavaScript WebPart, but it will work with any kind of WebPart without problems). Create the WebPart and open the working directory in Visual Studio Code.
Step 7. Azure Monitor has two different ways to be reached programmatically: using the SDK, or just inserting a small JavaScript in a HTML page. The second option is less functional, and it will not show statics in the Azure dashboard (you need to use the “Analytics” screen and send queries against the saved logs in Azure). It’s much easier to use the SDK, that comes in different flavors: .NET, .NET Core, Java, Node.js, JavaScript. To add the JavaScript SDK to the SPFx WebPart, from the Terminal Console of VS Core run:
npm install @types/applicationinsights-j
Step 8. Open the WebPart .ts file. To connect the WebPart with Azure Monitor, we then need to register the SDK in the declarations part of the code:
import {AppInsights} from "applicationinsights-js";
Step 9. Finally, we can add the code to send the information to Azure using any event routine:
let appInsightsKey: string = "xxxxxxxx-xxxx-xxxx-xxxx-xxxxxxxxxxxx";
    AppInsights.downloadAndSetup({ instrumentationKey: appInsightsKey });
    AppInsights.trackPageView();
Replace the “appInsightsKey” string with the “InstrumentionKey” value found in Step 5. The “downloadAndSetup” method downloads and injects the necessary JavaScript dynamically to send the local information to Azure. The “trackPageView” method gathers all kind of information from the application, and it can be filtered using several overloads (see here).
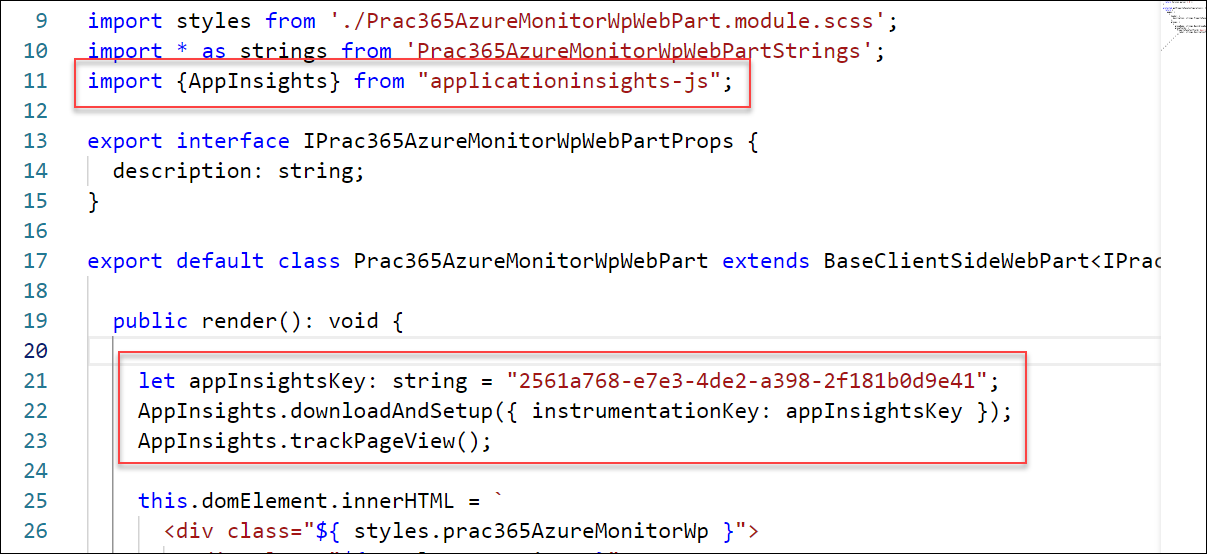
Figure 1. The SDK call inserted in the WebPart render event
Step 10. Generate the installation files and the package for the WebPart and install everything in a SharePoint page (it will work as well in a SharePoint Server 2016 with SP1 and 2019 modern page if the farm can reach Internet). After a couple of seconds, the WebPart starts sending information to Azure.
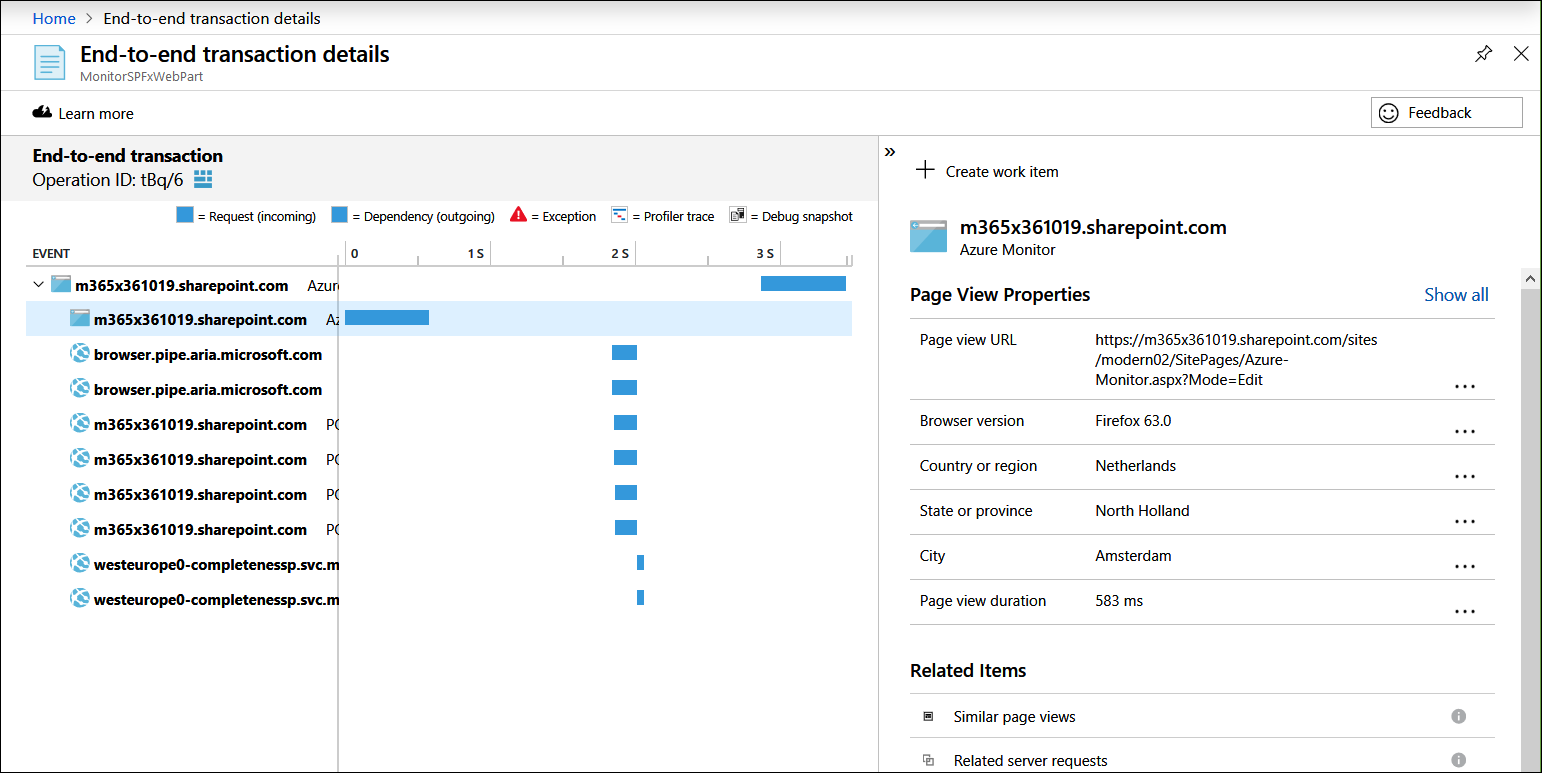
Figure 2. Initial information from the WebPart recorded in Azure Monitor
The Azure Monitor Dashboard
All the gathered information is saved in Azure Monitor as logs. The logs are available for download (with an option for “Continuous export”) to be used by other systems like Power BI, or shown directly from the Azure web interface in several ways.
The main dashboard for the Monitor can be reached from the “Overview” menu, by selecting the option “Application dashboard” (Figure 3). The dashboard is fully customizable, allowing you to add, pin, move and resize tiles.
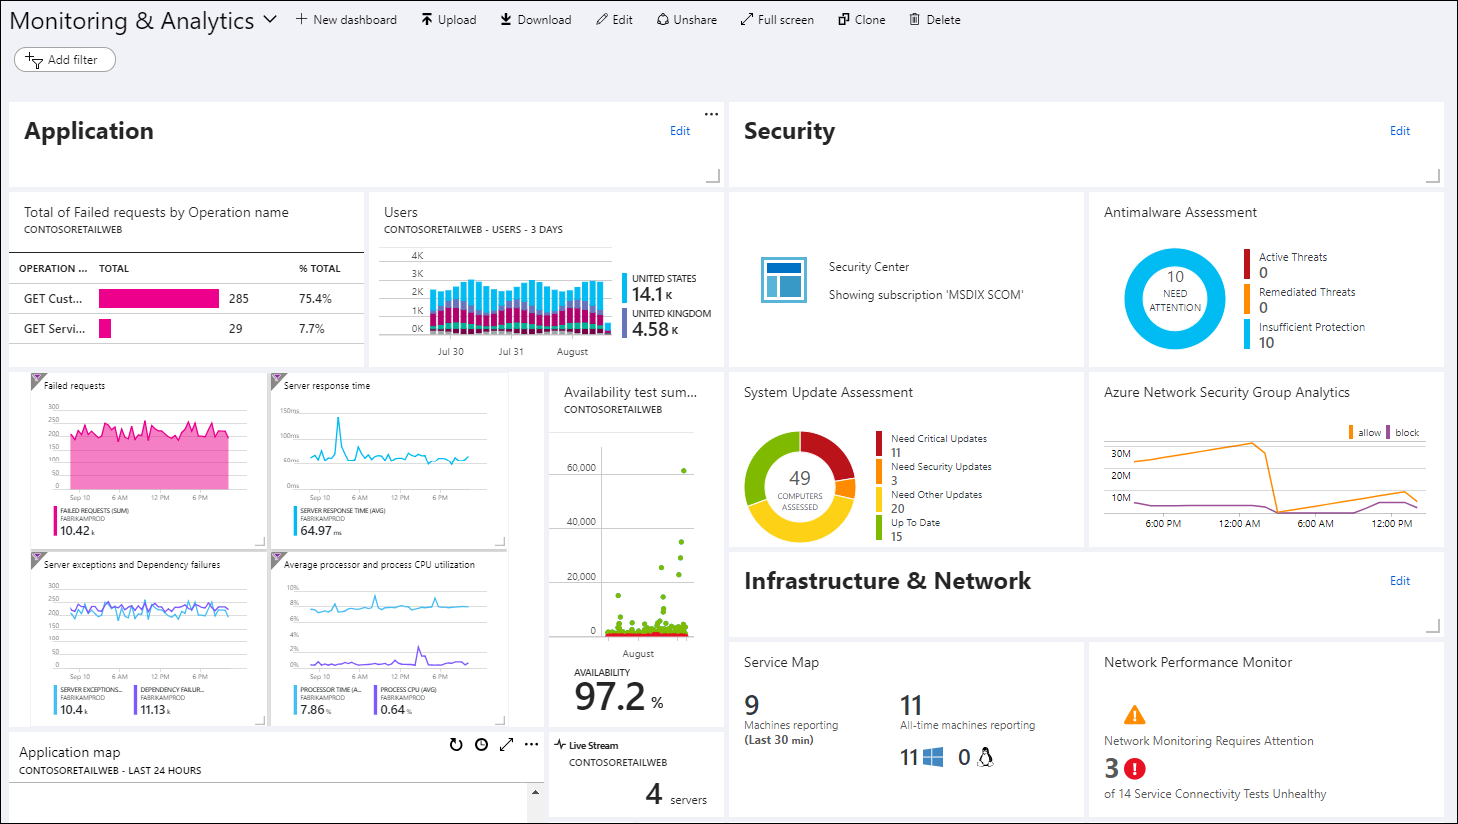
Figure 3. Azure Monitor Dashboard (source: Microsoft corp.)
Additionally, there are dedicated views to explore the monitored details: Metrics, Availability, Failures, Performance, Servers, Browsers, Users, Events, Sessions, etc. Each view has the possibility to drill down through several perspectives (time, application, user) as well.
As previously mentioned, the logs in Azure Monitor can be analyzed and visualized using the powerful query tool from the “Analytics” panel. There are aides in the tool to assist in the creation of the queries, together with IntelliSense and examples of preconfigured queries. If you need to review aspects that aren’t shown by default, you can create your own tile or dashboard in Azure Monitor. Using this extensibility, it is possible to connect the data in Azure Monitor with Azure Logic Apps (and Office 365 Flow, which is based on Logic Apps), because there are two “Actions” available: “Run Analytics query” and “Visualize Analytics query” that can be connected with any workflow.
In summary, Azure Monitor can be used in SharePoint in a pretty easy way, enriching the information that we can get from the system for analysis and monitoring, and allowing us to maintain the components and get the complete system under control.
Source code: https://github.com/gavdPublic/Practical365AzureMonitorAndSharePoint