Limited Perspective Means that the Teams Usage Report Doesn’t Reveal the Full Story
I was recently asked my opinion about the Teams usage report in the Microsoft 365 admin center and whether it can be used to determine inactive teams. My answer was emphatic: anyone who bases the decision to call a team inactive (and possibly remove) based on the usage report is using flimsy evidence. The problem is that the Microsoft 365 usage reports take a very narrow perspective of activity that’s limited to specific aspects of a single workload. In short, the Teams usage report doesn’t tell the full story.
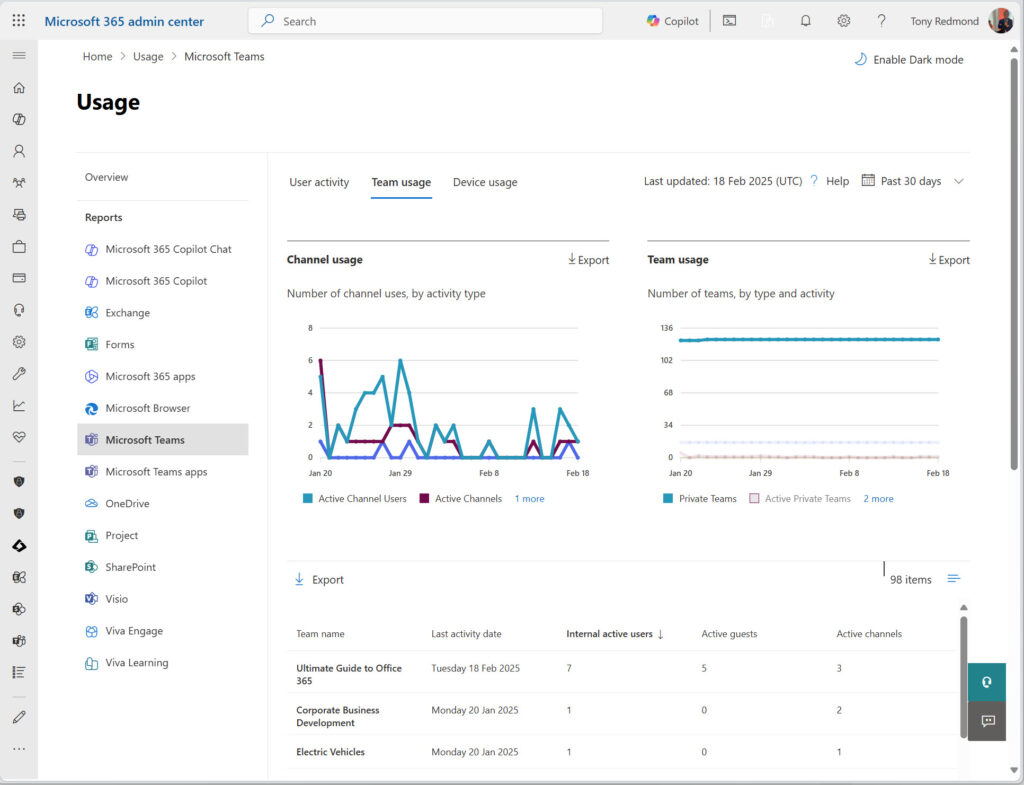
The problem with Teams is that teams are used in many different ways, with information flowing into channels from different sources. The usage report details the number of channel posts, replies, and mentions, but ignores user activity in SharePoint Online and other apps. Messages posted to channels through the Teams email connection are likewise ignored, as is information posted by apps, including declarative Copilot agents. The Teams usage report does a great job of traditional messaging activity centered around user conversations in channels, including channel-based meetings. Outside of that measure, the usage report doesn’t give any practical or useful indication of whether a team is active. Another way of saying this is that the Teams usage report (Figure 1) is useless in terms of assessing teams activity.

The Problem with the Teams Activity Detail API
The Teams usage report available in the Microsoft 365 admin center uses the getTeamsTeamActivityDetail API to retrieve information from the data store where Microsoft stores usage data. Any app that uses the same API retrieves the same data and suffers from the same weakness. Magic is not applied to make the usage data any better.
To improve the data, we need to fill in usage gaps. For instance, it’s a well-known fact that many Teams users prefer to use group chats instead of channels to host conversations. If you doubt this assertion, check the Teams user activity report and compare the number of chat messages posted versus channel messages posted. Chat volume is usually higher, except where users are very disciplined, or chat is disabled. However, chat messages don’t tell us anything about team activity.
SharePoint File Activities
SharePoint Online activity is informative. A lot of SharePoint activity occurs through Teams, perhaps because people find it easier to navigate SharePoint through Teams than through SharePoint’s browser interface. If there’s file activity in the site that belongs to a team, it’s evidence that the team is active.
A SharePoint site usage report is available. However, that API has suffered from a longstanding problem where it stopped including the site URL in the data it fetches. The issue has persisted since September 2023 and Microsoft shows no signs of fixing it. Maybe they will have by the time you read this, but in the interim, a different mechanism is required to fetch SharePoint data.
The audit log stores details of SharePoint file activities, so it’s the obvious choice. Due to the number of SharePoint file activities that can occur in a large tenant, the AuditQueryLog Graph API is the best way to search. The audit query job runs asynchronously in the background, but that’s easily handled. Before you can run audit jobs, your account must have permission to search the audit log.
Another source of data is to retrieve the number of messages from each channel. Unlike the usage report, this information includes messages posted by apps, bots, and agents. However, the additional insight gained from understanding non-human posting is probably not worth enough to justify the processing required to access every channel in every team to fetch its data, so let’s leave that idea to one side. The getAllMessages API isn’t viable either. It’s an export API that’s metered and could result in heavy charges.
Sketching the Solution (Script) to Supplement the Data from The Teams Usage Report
Bringing everything together, the steps involved in a script to identify inactive teams are as follows:
- Create and submit an audit job to find SharePoint file activities for the assessment period (the script uses 30 days, but the period could be as short as 7 days and as long as 180 days).
- When the audit job finishes, retrieve the audit events and parse them to create a PowerShell list detailing the file uploaded and file modified events for each site.
- Change the tenant settings if necessary to ensure that the report data is not anonymized. We need full team details to match the data from the two sources. Naturally, if the script changes the tenant setting to make the data available in clear, it resets the setting afterward to make sure that personal information remains inaccessible in usage reports.
- Download the team activity report for the last 30 days.
- Run the Get-MgTeam cmdlet to fetch the list of teams. Oddly, the cmdlet doesn’t support the ability to filter out archived teams, so this must be done later.
- Process each team and find the URL for the site used by the team.
- Use the URL to find details of file activities from the audit data.
- Combine the usage data and the file data into a single report.
- Find the set of teams that seem to be inactive. For the purpose of this exercise, I decided to total all the various activities and deem any team with fewer than 100 activities over the 30 days to be potentially inactive. Your mileage might vary.
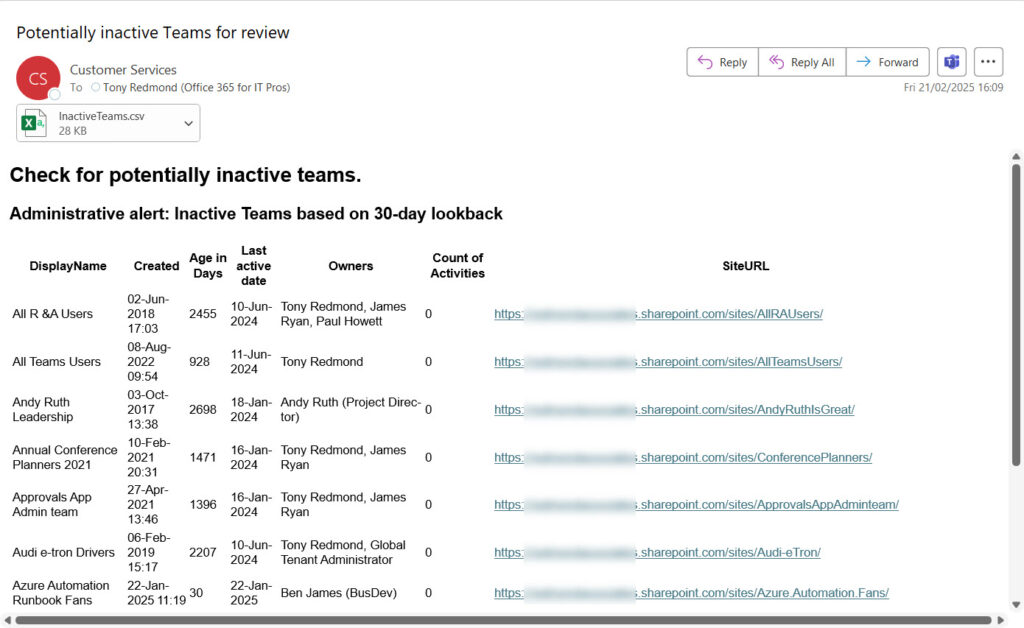
- Extract the set of inactive teams and use the Send-MgUserMail cmdlet to send details of the teams in an email to a nominated recipient. The full report data is included as an attachment to the email.
An example of the email is shown in Figure 2.
You can download the script I used from GitHub. Remember that the intention of the code is to explore the principles of combining usage data available from the Graph with information from another source (or sources) to create a more comprehensive picture. The script runs in app-only mode (see the set of required permissions in the script comments) and could easily run as an automation runbook using a managed identity for authentication.

Look for Extra Data to Fill in Gaps
The major takeaway is that you should never assume that a report found in a Microsoft administrative portal delivers definitive information. The way Microsoft 365 works and the way that apps consume shared services like auditing, email, and document management means that often additional information is available only if you go looking for it. The advantage of the Microsoft Graph is that it makes it easy (in relative terms) to access the data, once you know how to find it and what permissions are needed.
Another example where using an additional data source to supplement usage data is when reviewing the use of Microsoft 365 Copilot licenses with the intention of reassigning underused licenses to more worthy users. The same technique of retrieving data from audit records to help make better decisions could be employed to fill in the gaps left by the sparse Copilot usage report. Eventually, I’ll get around to updating that script!


Maybe it doesn’t fit all use cases but we enabled group expiration so it will automatically clean up old groups. But you could set a long window of years so that you can get the expiration timestamp and use it for a manual process.
Thank you for all your amazing articles and scripts!
I meant, Microsoft 365 group expiration policy
I use the expiration policy too (with a two-year expiration), but the policy doesn’t take account of very many indications that a group is active so it’s not terribly reliable in terms of detecting truly inactive groups.
Good morning,
sounds very good and nearly that, what we are looking for. We are using some Teams only for Plannertasks, because Planner still not works in private channels. Do you know, how we get these activites also?
Thanks
Planner activities are also noted in the audit log. Have you tried searching for Planner activities using the Audit solution in the Purview compliance portal? You’ll find the events there and be able to determine what activities to include in future searches.