Last week, I discussed how to write a PowerShell script to generate a report of inactive guests based on real activity rather than just last sign-in dates. Such a report is useful in keeping tabs on guest accounts that tend to linger without doing anything. Apart from cluttering up the directory, unused guest accounts don’t do much harm.
However, unused member accounts can cost real money if they are assigned expensive licenses. I don’t intend to go over calculating the monthly cost of licenses assigned to user accounts, as that topic is dealt with in this article. Instead, this article is all about assembling evidence that an account is inactive and is therefore a potential candidate for action, such as removing licenses or even disabling (and eventually removing) the account.
The User Activity Report Script
Over the past several years, I have worked on a script to generate a Microsoft 365 user activity report covering multiple workloads. The original script appeared in 2020, and I updated the code to create the last version in 2022 to take advantage of the (then) new 180-day lookback period for user activities. Now I’ve revisited the code to upgrade it to use the Microsoft Graph PowerShell SDK instead of Graph API requests and to make the script suitable for deployment as an Azure automation runbook. In addition, I fixed some problems, such as working around Microsoft’s continuing refusal to output SharePoint Online site URLs in usage data, and I added more information to the output. Version 2.1 is available for download from GitHub.
The original idea behind the script still holds. Assessing the activity or inactivity of a user account can’t be done by checking a single workload. For instance, someone who is super-active in SharePoint Online and OneDrive for Business might never use Teams or Exchange Online, and if user activity is measured on the basis of meetings organized or messages sent, that person shows up as inactive, and their account might be a candidate for removal. Of course, no sensible administrator would delete a user account on such flimsy evidence, but the point remains that a holistic tenant-wide view of user activity is more informative than single-workload measurements.
The script therefore assembles usage data for SharePoint Online, OneDrive for Business, Teams, Exchange Online, and Viva Engage (Yammer) to build a picture of user activity across a range of workloads. If someone isn’t active in these workloads, it’s unlikely that they are very active elsewhere.

Available Usage Reports APIs for Microsoft 365 Workloads
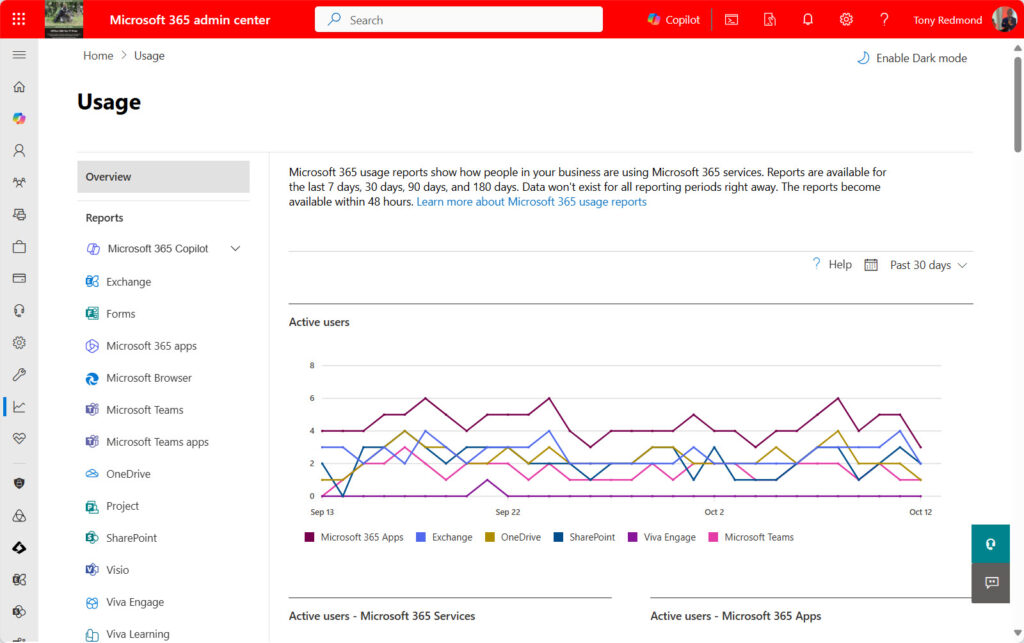
Why these workloads? Quite simply, it’s because these are the workloads supported by the Microsoft Graph usage reports API. The same APIs power the usage reports available for workloads in the Microsoft 365 admin center (Figure 1). Not all of the workloads listed in the reports section are backed by public usage report APIs. For instance, APIs are unavailable for Planner, Visio, Project, or Forms. A usage reports API is available to track Microsoft 365 Apps, but I don’t think that understanding how often someone uses Word or PowerPoint helps too much.
A usage reports API is available for Microsoft 365 Copilot. Given the very high cost of these licenses, I have a dedicated script to analyze Copilot usage with the aim of identifying underused Copilot licenses that can be reassigned to more deserving users. If you’re interested in including the Copilot usage data, it would be easy to merge code from that script into the user activity report script.
Report Data Obfuscation
To be able to combine usage data for several workloads together, it’s important to have a reliable anchor. The user principal name is the only available anchor because usage data doesn’t include the GUIDs for account identifiers.
Microsoft 365 allows organizations to obfuscate report data, which means that the personally identifiable information is anonymized to protect privacy. The script checks if the tenant setting to obfuscate usage report data is set. If it is, the script updates the setting to allow it to fetch the “real” data. Once processing is complete, the script resets the setting to its original value.
Interactive or Azure Automation
The script can be executed interactively or as an Azure Automation runbook. The normal prerequisites apply before the code will run. For Azure automation, make sure that the necessary Graph SDK sub-modules are installed as automation account resources. This script is a good example of the kind of process that works well when run automatically using an Azure automation schedule. A monthly review of user activity is probably as frequent as you need.
For both interactive and Azure automation, the listed Graph application permissions must be available. Details of the required modules and permissions are listed as comments in the code.

Writing the Code
Now that the preamble is dealt with, let’s plunge into the details of the script. The basic idea is quite simple: fetch data for each workload and use the data to create a hash table keyed on the user principal name with the value being an array of the data from all workloads.
The script uses Graph API requests to fetch usage report data. Microsoft Graph PowerShell SDK cmdlets are available, but some known problems exist for these cmdlets. To be safe, I decided to stay with the Graph APIs. Here’s an example:
Write-Output "Fetching Exchange mailbox usage data for the last 180 days..."
$MailboxUsageReportsUri = "https://graph.microsoft.com/v1.0/reports/getMailboxUsageDetail(period='D180')"
[array]$MailboxData = $null
Try {
    Invoke-MgGraphRequest -Uri $MailboxUsageReportsURI -Method Get -OutputFilePath $EmailStorageDataFile
    [array]$MailboxData = Import-Csv -Path $EmailStorageDataFile
} Catch {
    Write-Output "Error fetching Exchange mailbox usage data: $_"
}
After gathering the usage information from all workloads, it’s a matter of looping through user accounts to extract and format the statistics for each account. In addition, the script includes a simple scoring system based on when a user accessed each of the five measured workloads. Essentially, the script knows how many days since a user last accessed Exchange, SharePoint, Teams, OneDrive, and Viva Engage. By computing the average of the days, we get a score. Because the usage data is at least two days behind real time, a heavy user of all workloads will have a score of around 12. The longer someone doesn’t use a workload, the higher their score is, and the worse their assessment to the point where the script regards the account as being unused.
The scoring scheme is easily adjusted to match the circumstances of your tenant. Given the use of emojis everywhere in Microsoft 365 these days, it seems fair to include some emojis in this assessment:
Switch ($AverageDaysSinceUse) { # Figure out if account is used
    ({$PSItem -le 12})                         { $AccountStatus = "🟩💪 Heavy usage" }
    ({$PSItem -ge 13 -and $PSItem -le 50} )    { $AccountStatus = "🟨🙂 Moderate usage" }
    ({$PSItem -ge 51 -and $PSItem -le 120} )   { $AccountStatus = "🟧😐 Poor usage" }
    ({$PSItem -ge 121 -and $PSItem -le 300 } ) { $AccountStatus = "🟦🧐 Review account"  }
    default                                    { $AccountStatus = "🟥🚫 Account unused" }
} # End Switch
Output for the User Activity Report Script
The output is either a CSV or Excel worksheet (depends on the availability of the ImportExcel module on the workstation). Figure 2 shows a sample of the data output (only some of the fields are shown here). Both regular user accounts and the accounts used by shared mailboxes are included in the report.
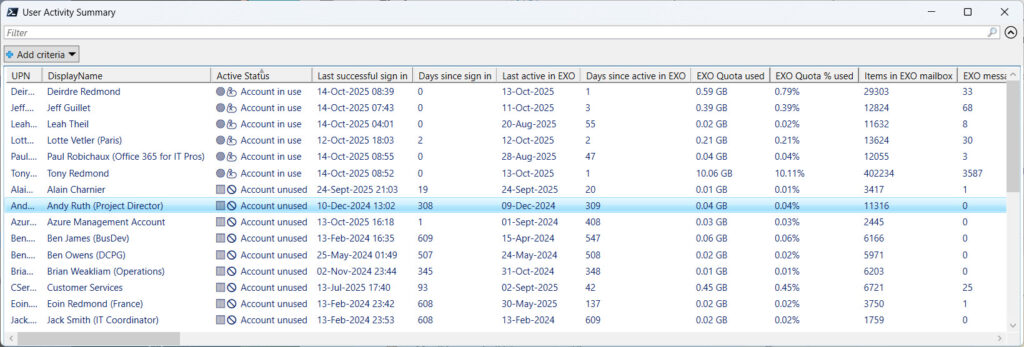
The output file is emailed to a destination email account set in the script. It would be easy to import records from the output file to extract the accounts marked as not in use and delete those accounts. But that’s perhaps a step too far in the pursuit of a tidy tenant.
Extending the Standard View of Usage
The Microsoft 365 admin center certainly delivers many useful usage reports. The only issue I have is that the data is organized in silos. Using PowerShell to combine the data from multiple workloads to create a holistic view of what people do in a tenant just seems like a good idea. Hopefully, you agree.


Thank you Tony, sounds very useful! Will test it out! Have a good day!