Making More Use of the Planner Graph APIs
Last month, I reported how Microsoft upgraded the Planner Graph APIs with application permissions. This change is important because it opens up more opportunities for automation. I included a demonstration script to illustrate the principles of how to extract and report details of all the plans in a Microsoft 365 tenant. The script had a bug or two that I subsequently fixed. At the same time, I took the chance to upgrade the script to add two features requested by readers.

Listing Incomplete Tasks
The first change is to include a listing of incomplete tasks for each plan. The idea is to generate an overview of work that’s ongoing in plans. The age of the task and the number of days since the assignment highlight tasks that might be dragging on a little too long.
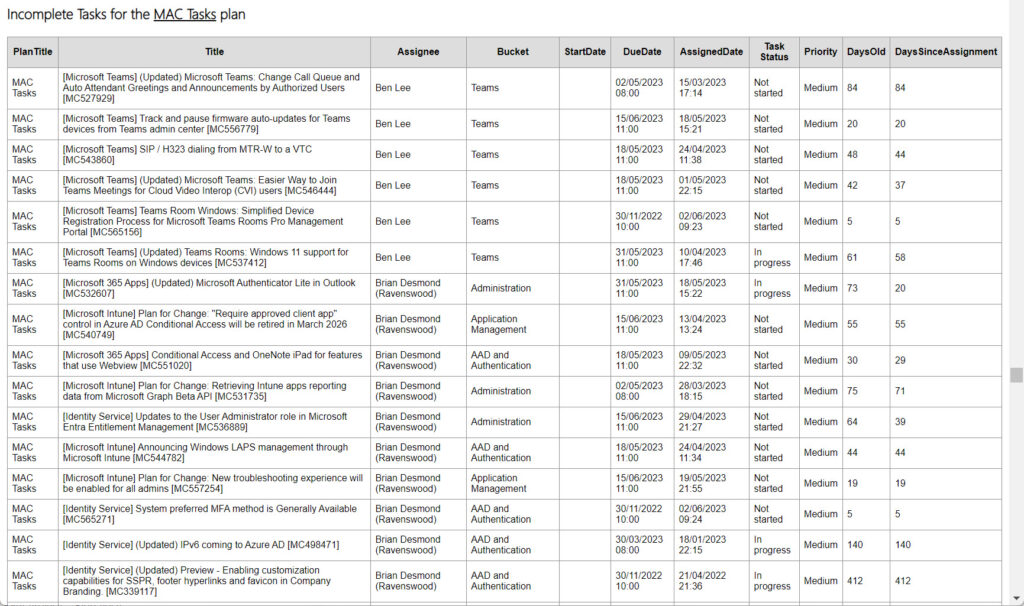
Creating the incomplete task listing for a plan isn’t difficult. The previous version of the script already fetched the set of tasks for a plan, so the only processing needed was to:
- Filter out completed tasks.
- Translate the internal values used to mark task priority (for example, 5 = medium) to text.
- Similarly, translate the percentage of task completion to a text value.
- Calculate how old the task is (number of days since creation) and how long it’s been since someone assigned the task to the current owner.
None of these steps required additional Graph requests as they operate against available task data.
Viewing Individual Task Assignments
Tasks are assignable to any member of the plan roster. For plans owned by Microsoft 365 groups, this means any group member. Loop task list components use lightweight containers for their plans, with the membership composed of accounts with access to the component. The script ignores lightweight plans.
Within any group, it’s likely that some people are better at dealing with assigned tasks than others. It’s also possible that some receive more assignments than others, so work is unequally distributed. And some folks are less assiduous than others at closing tasks when the work is complete, meaning that the number of tasks open against their name is much higher than it should be. For these reasons and more, task management for group members can be “problematic.”
Planner includes a chart of task assignments for group members (Figure 2). The chart is useful as a high-level overview, but it suffers some problems. Filters are available to help (for instance, to only include incomplete tasks or tasks for specific members), but they only refine the data displayed in the chart.
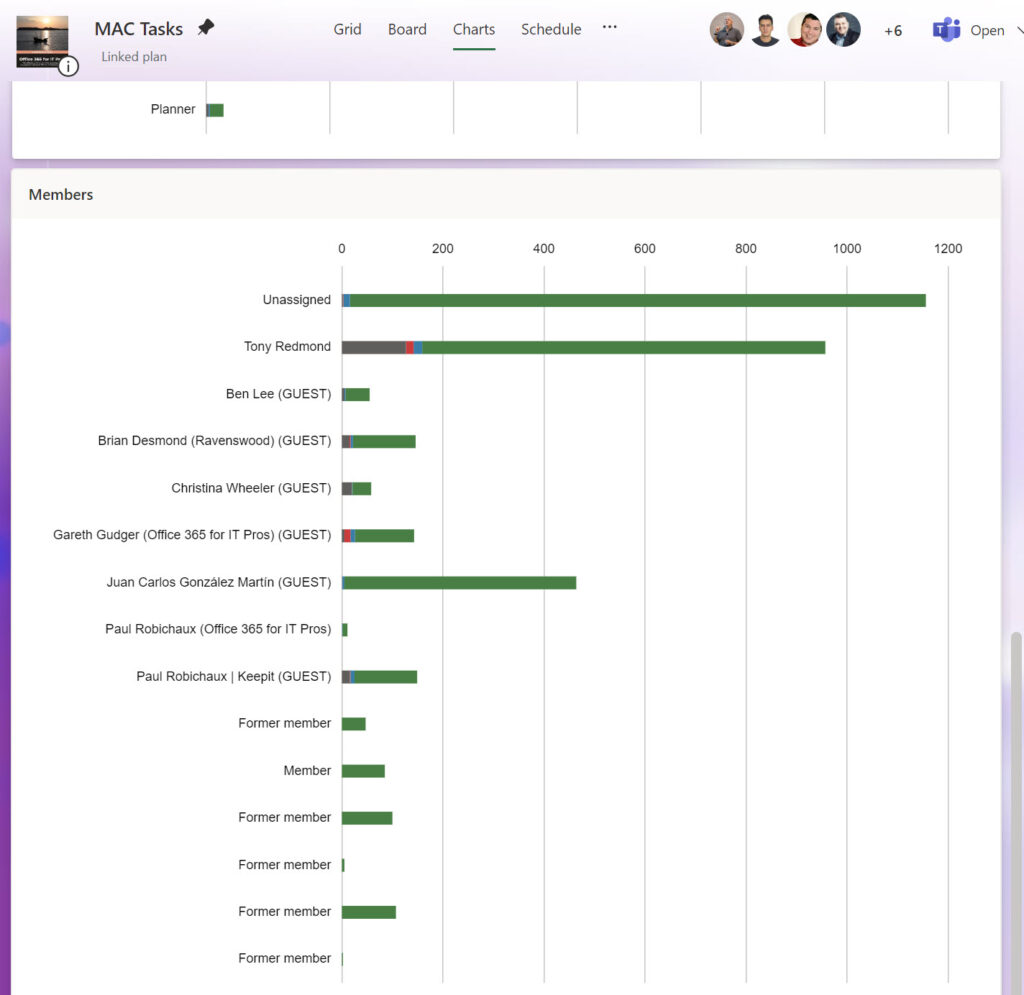
The data shown in Figure 2 features an extraordinary number of unassigned tasks. Every plan is different, and in this case, the Office 365 for IT Pros eBook team track changes published in the Microsoft 365 message center by synchronizing message center posts to Planner. Some of the message center posts are informative and can be immediately closed, like those announcing an update is available for Microsoft 365 apps for enterprise, and some have no relevance to the content of the book. Finally, sometimes duplicate tasks appear when Microsoft reissues message center posts or updates the date when code updates will appear. We close these tasks immediately, which accounts for the high number of unassigned tasks.
Getting back to individual task assignments, in most cases, people want to know about incomplete tasks. Completed work is soon forgotten, but incomplete tasks weigh on the mind, or something like that. The chart tells how many task assignments someone has, and a filter can reduce the set to incomplete tasks, but that’s about it. We can do better.
Figure 3 shows the assignment analysis generated by the report script for incomplete tasks belonging to the different authors and editors who work on the Office 365 for IT Pros eBook. As you can see, the highest number of incomplete tasks are on my docket. I can only plead that I cover more chapters than any other writer. I could also say that I am sometimes guilty of not completing paperwork and closing tasks. Anyone with tasks aged more than a hundred days on average since assignment possibly needs some help to clean up their assignments!
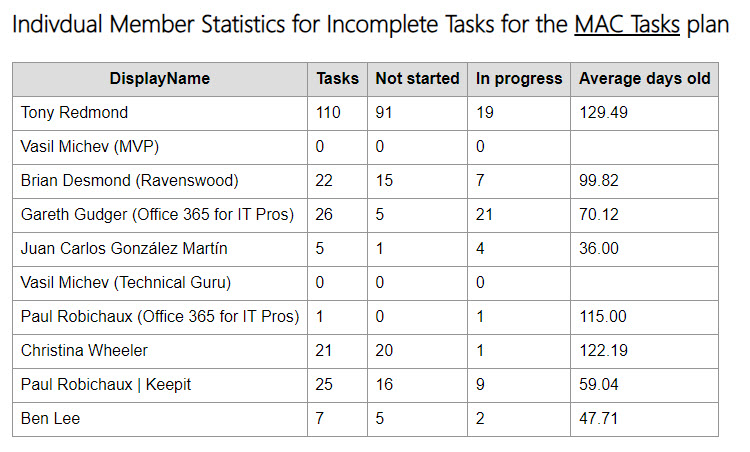
The code to generate the incomplete task analysis is simply a matter of looping through each group member to discover if they have any active tasks and doing some basic calculations.
V2.0 of the example script (downloadable from GitHub) includes the code to generate the incomplete task list and individual member statistics.
Get Your Thinking Hats On
Access to data liberates creativity. With access to Planner data through the Graph, people can have a much richer understanding of what the data means. My example only scratches the surface of what’s possible. For instance, people have asked Microsoft to improve the set of charts included in Planner. Some would like to see a Gantt chart in the available set. Delivering on the request might bring Planner too close to Microsoft Project, but I’m sure that someone more capable than me with manipulation of a graphics library could do the job.
TEC Talk: What to Do About Exchange On-Premises After Microsoft Starts to Block Messages
Hear what Tony Redmond has to say about what might happen if your org is using older on-premises Exchange servers.